

How much do people differ in productivity? What the evidence says.
People sometimes point out that performance is ‘power law’ distributed, e.g. they’ll point out that the top 10% of scientists get 5x more citations over their career than the other 90% of scientists, or that the top 1% of startup founders get 80% of the equity value.
But is this true? And if so, what does it imply?
I think these differences in performance can be really important, and their significance is often not properly appreciated. But it’s also often oversold.
To better understand how much people predictively differ in productivity, Max Daniel of the Future of Humanity Institute and I did an informal review of the academic research.
We found there’s relevant research in several fields (often pursued independently) including economics, organisational psychology, expert performance, scientometrics, and physics.
We aimed to get an overview of what’s out there and combine it with our own understanding to see if we could draw any practical lessons for hiring managers or people planning their careers.
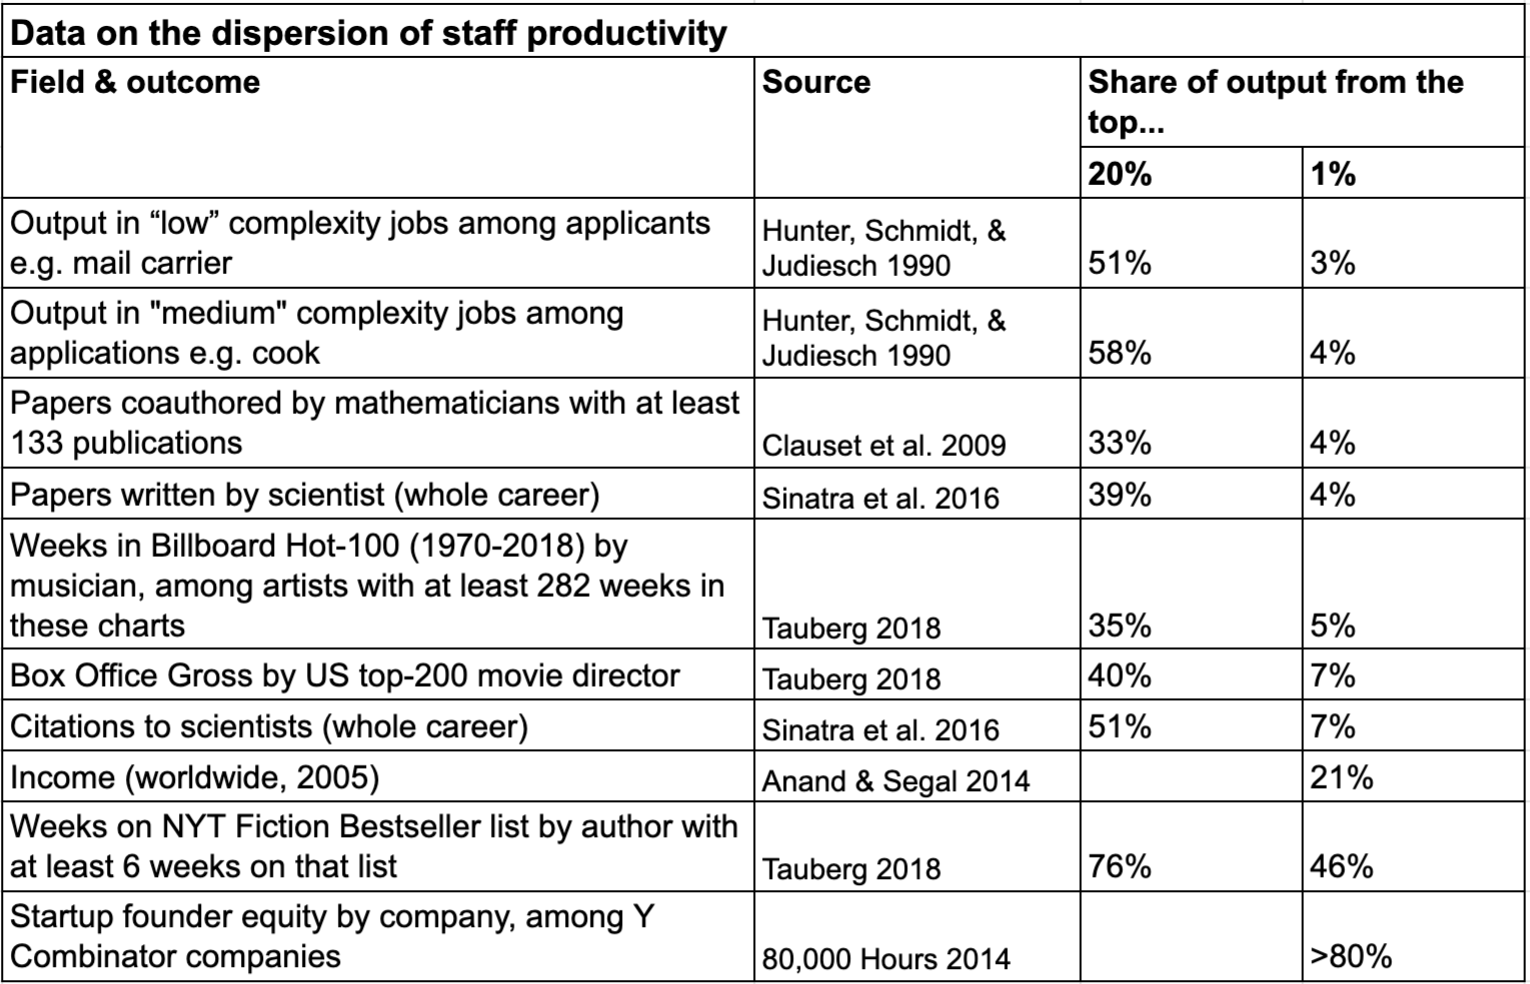
Here’s a summary of some of the data we found in the review:
And here’s a 10-point summary of what we learned. (See the full write up here, and discussion on the EA Forum.)
1) ‘Power law’ sounds catchy, but identifying which distribution to use is hard to do, statistically.
Distinguishing power laws from log-normal distributions is notoriously difficult, and many papers fail at doing this correctly. If anything, log-normal distributions usually seem like a better fit.
Very often we just won’t be able to tell based only on the data we’ve collected — i.e. different types of distributions may be a similarly good fit.
Rather than try to pick a single type of distribution, we think it’s usually more useful to try to estimate how much of the average is determined by outliers. For instance, how much of total output comes from the top 10% or top 1% of performers. The greater the fraction, the more ‘heavy tailed’ the distribution is.
2) Depending on the context, output can fall anywhere on the spectrum between being pretty thin tailed and very heavy tailed.
Output measures that look relatively heavy tailed include things like income, media sales, startup profits, and scientific citations. But there are large differences in how heavy tailed: The top 10% seem to account for between 1/3 and almost all output.
In the extreme case of startup outcomes, 80% of total equity is held by around 1% of founders (in a sample from Y Combinator).
By contrast, performance in many regular jobs seems at the thin tailed end of the spectrum, with the top 10% accounting for around 1/4 and the top 1% for 3–4% of all output.
See table above for a summary of the data, and the full tables of datasets we found on p.7 in the full piece.
(One interesting aside is that the distribution often becomes more heavy tailed among groups that are higher performing. For example, the differences between top 1% scientists are bigger than those between scientists in general.)
3) What determines how heavy tailed output is in a particular case?
People commonly say that heavy-tailed output is obviously due to positive feedback loops in popularity, rather than genuine differences in output. It’s true this is one mechanism that can lead to heavy tails, but there are others.
One paper argued that there are 5 factors that can lead to heavy-tailed output, which I’ve summarised as follows:
- Scalable output with no ceiling
- Complex, autonomous work
- Winner-takes-all ‘superstar’ effects and positive feedback loops
This makes it clear why book author output would be heavy tailed. For instance, once a writer has written a book, it can be sold an unlimited number of times with no additional effort (scalable output); writing a book is complex and autonomous, so the best authors will create a better product; and more successful authors gain more fans, which makes their next book even bigger, constituting a positive feedback loop.
We can also see that what we mean by ‘output’ or ‘productivity’ is relevant. A metric like citations could be heavy tailed even if ‘scientific ability’ is not, since citations might e.g. be subject to winner-takes-all effects in a way that scientific ability is not (e.g. if everyone cites the paper that already has the most citations). Though the other factors listed above would still suggest scientific productivity is heavy tailed (e.g. output is scalable, has no ceiling to its value, and production is complex and autonomous).
4) Even if past output is heavy tailed, that might be due to luck: A lottery has heavy-tailed outcomes, but each ticket had an equal chance of winning ahead of time. It seems likely that luck plays a significant role in the real world.
5) Practically speaking, we care about future output rather than the past, so if the heavy tail is driven by luck, it’s not practically that important.
6) When looking at future performance, we need to know the predictors of performance, and how they combine. But we usually don’t.
Even if we have a predictor (e.g. IQ), the tail might still be mainly driven by luck (e.g. if output = luck + intelligence and luck itself has a heavy tail).
So the forward-looking distribution might be thin tailed, even though it’s heavy tailed looking backwards.
That said, it’s also easy to create simple models where output is heavy tailed and semi predictable.
For instance, if output is the product of many different abilities, then it will be relatively heavy tailed (e.g. intelligence, effort, social skills). And if you can estimate many of the relevant abilities ahead of time, then the forward-looking distribution will be heavy tailed also.
Another model with heavy-tailed outputs is ‘o-ring production‘ — if successfully performing a task involves a series of steps which each have to be done correctly, then if someone has a slightly better chance of completing each step, their probability of completing the task can be dramatically higher. (The name comes from the Challenger disaster, where a complex shuttle launch was brought down by the failure of a single component: o-ring seals in the shuttle’s joints.)
On the other hand, if output is produced by the addition of factors or steps, then it will be fairly thin tailed.
7) Where are we left? My guess — based on thinking about the mechanisms that drive performance, and the data — is that forward-looking outputs are still heavy tailed in some important domains, though they’ll typically be less heavy tailed than naively looking at past data would suggest.
8) We have the clearest evidence for semi-predictable heavy tailed output in science — for example, International Mathematical Olympiad scores in high school predict future publications. A more involved paper found that even accounting for luck, early-career performance predicts lifetime publications.
9) Heavy tail + thin tail = heavy tail, so if unsure between the two, guess heavy tail (though the tail will get thinner the more uncertain you are).
10) What does all this imply?
If you’re considering working in paths with heavy-tailed, semi-predictable performance — like scientific research — then it could be worth switching paths to get a small increase in relative fit. Going from the 80th percentile to the 90th or 95th percentile, for example, could mean your expected output is several times higher.
When hiring, it would mean investing a great deal in advertising and selection.
In contrast, in fields where output is thinner tailed and/or less predictable, selection is less vital, though there might still be noticeable differences.
You might also be interested in:
- See the full research on how much people differ in performance and discussion on the EA Forum
- How replaceable are candidates in large hiring rounds?
Read next
This article is part of our advanced series. See the full series, or keep reading:

If you enjoyed this post, sign up to get monthly updates on our latest research about how to have a high-impact career:
You can unsubscribe with one click.
Or you can ask a question about this research or follow me on twitter.