

Update on number of significant plan changes
NOTE: This piece is now out of date. More current information on our plans and impact can be found on our Evaluations page.
This is a brief update on the number of significant plan changes we’ve caused as of the end of Dec 2015.
We define a significant plan change as:
Someone tells us that 80,000 Hours caused them to change the career path they intend to pursue, in a way that they think increases their lifetime impact.
More on what counts as a significant plan change here.
Our total number of significant plan changes as of the end of Dec 2015 is 453.
Here’s a summary of our key figures:1
| Year | 2011 | 2012 | 2013 | 2014 | 2015 | All-time total |
|---|---|---|---|---|---|---|
| Reach: Unique visitors to site | 4,266 | 46,924 | 91,999 | 149,164 | 513,697 | 806,050 |
| YoY growth rate | NA | 1000% | 96% | 62% | 244% | NA |
| New significant plan changes recorded (at end of year) | NA | NA | 26 | 74 | 353 | 453 |
| YoY growth rate | NA | NA | NA | 185% | 377% | NA |
| New impact-adjusted significant plan changes recorded (at end of year) | NA | NA | 125 | 148.7 | 326.9 | 600.6 |
| YoY growth rate | NA | NA | NA | 19% | 120% | NA |
| Impact adjusted significant plan changes attributable to online content | NA | NA | 1 | 59.2 | 154 | 214.2 |
| Impact adjusted significant plan changes attributable to coaching | NA | NA | 47 | 20.2 | 51 | 118.2 |
| Impact adjusted significant plan changes attributed to other | NA | NA | 77 | 69.3 | 121.9 | 268.2 |
| Financial costs | 0 | £23,171 | £124,008 | £119,326 | £226,402 | £492,907 |
| Labour costs (in person-weeks) | 78 | 159 | 351 | 231 | 237.2 | 1056.2 |
| Total financial costs to date divided by total plan changes | NA | NA | £5,661 | £2,665 | £1,088 | £1,088 |
| Total financial costs to date divided by total impact adjusted plan changes | NA | NA | £1,177 | £974 | £821 | £821 |
Note: “YoY growth rate” stands for “year-on-year growth rate”. Also note that our financial cost figures for 2015 are preliminary.
Table of Contents
Impact-adjustment of significant plan changes
In October 2015 we decided to start estimating the relative value of the significant plan changes, so that we had a better sense of our overall impact. To do this, we now score each significant plan change with a value of 0.1, 1 or 10. The score is meant to represent how much extra counterfactual impact will result from a plan change.
A typical plan change scored 10 is someone who, in large part due to us, switched to working at a highly effective organisation like GiveWell, became a major donor (>$100k/year) to effective organisations, or become a major advocate of effective causes.
A typical plan change scored 1 is someone who has taken the Giving What We Can pledge or decided to earn to give in a medium income career. We also award 1s to people who want to work on the most pressing problems and who switch to build better career capital in order to do this, for instance doing quantitative grad studies or pursuing consulting; people who have become much more involved in the effective altruism community in a way that has changed their career, and people who switch into policy or research in pressing problem areas.
A typical plan change scored 0.1 is someone shifting to gain better career capital but where they’re less obviously focused on the most pressing problems, or where they’ve switched into an option that is less obviously higher impact than what they were planning before.
For brevity, in the remainder of this post, we’ll use the term ‘plan changes’ to refer to significant plan changes.
Number of plan changes
Our total number of plan changes as of the end of Dec 2015 is 453, and after impact-adjusting these it’s 606.6.
Here are our plan changes by year:
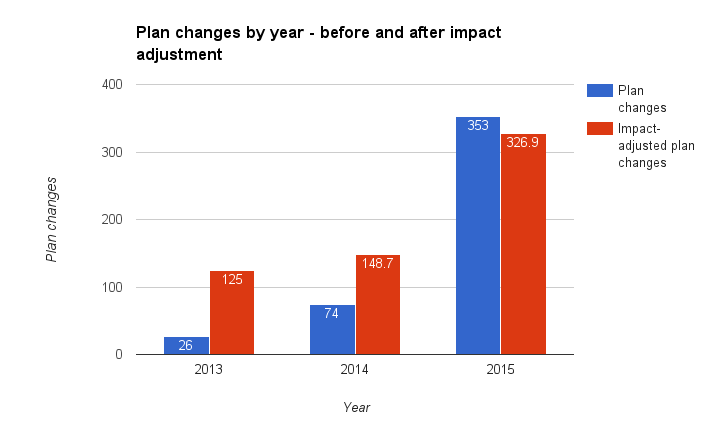
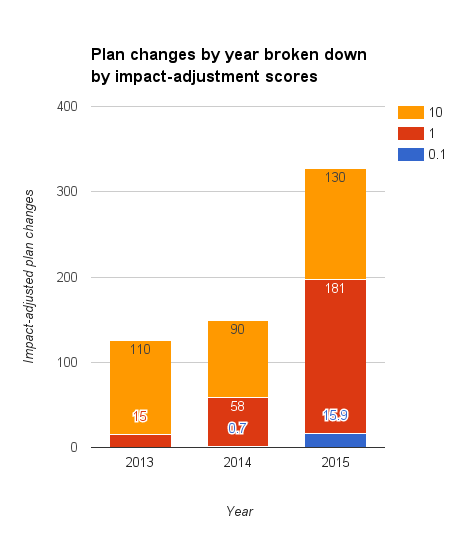
Here are the impact-adjusted plan changes by year, broken down by their scores:
Note that we only started collecting plan changes in 2013, but started outreach in 2011. This means the 2013 figures reflect three years of work rather than one, so our growth from 2013 to 2014 was better than it looks from this chart.
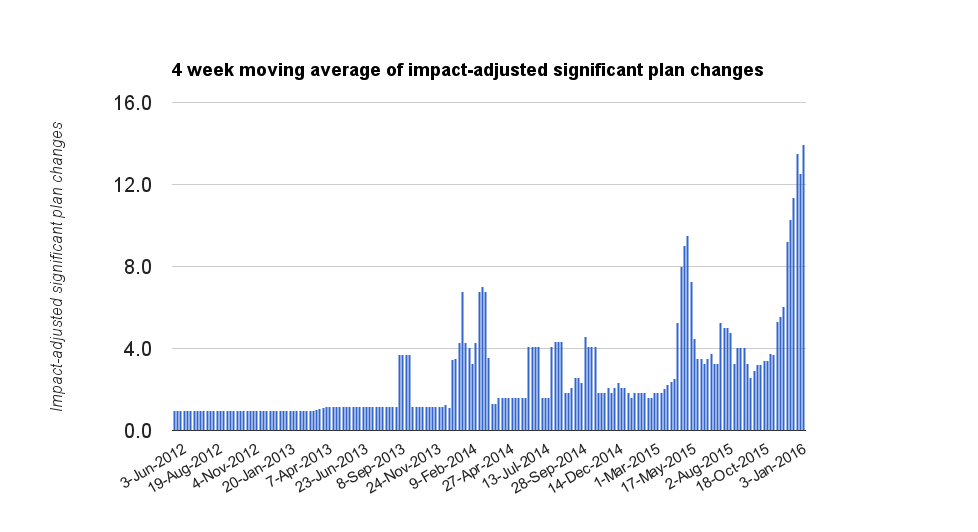
Our growth increased more in late 2015 than can be seen in the annual figures. Here is our growth by week (with plan changes we found out through our annual impact surveys amortised by week):
Causes of plan changes
We ask each person who reports a plan change “What was most significant in triggering these plan changes?”
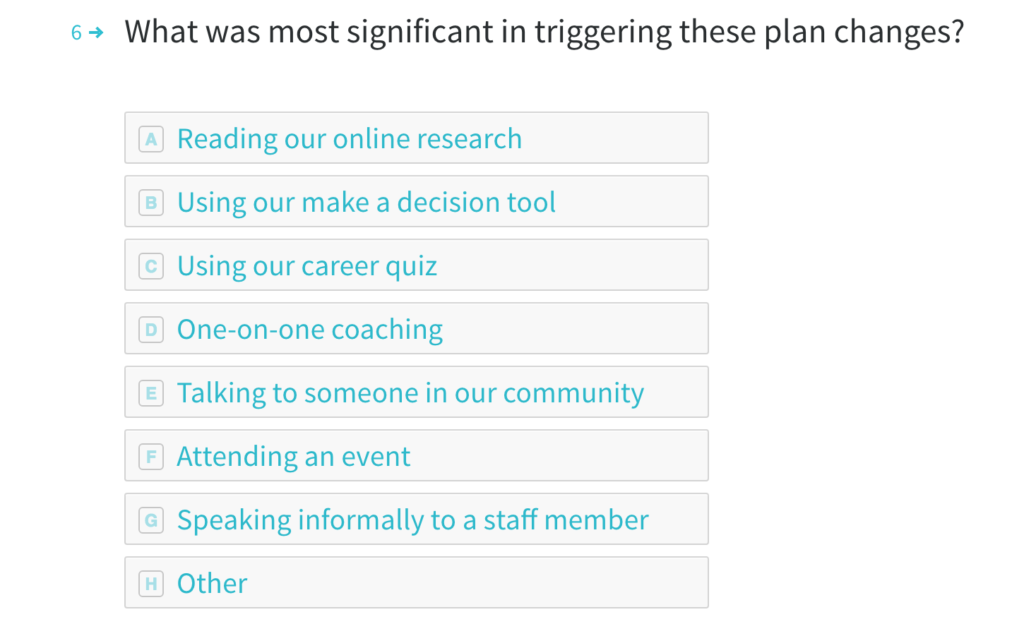
In 2015, the most common causes of plan changes were reading our online content (42%), talking to someone in our community (20%) and one-on-one coaching (16%).
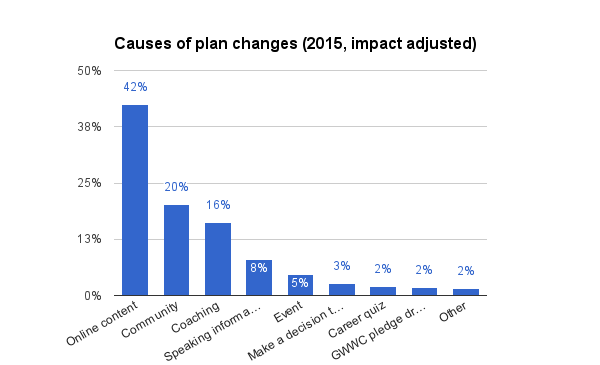
Compared with previous years, plan changes caused by online content have gone up, and the percentage of plan changes caused by our community and coaching have gone down.
Notes and references
- In our previous report last year the numbers of plan changes for 2013 and 2014 are reported as slightly higher than the numbers we present here. This difference is due to people who made plan changes in 2013 and 2014 making subsequent plan changes in 2015 or 2016 with a higher impact adjusted value, meaning they are recorded in later years instead, and due to disconfirming previous plan changes in light of new information.↩