

Review of program performance May 2015
NOTE: This piece is now out of date. More current information on our plans and impact can be found on our Evaluations page.
Summary
In this report, which is part of our annual review, we review how our programs performed over the last year (ending April 2015).
The key metric we use to measure the performance of our programs is “significant plan changes”. A significant plan change is when someone tells us that they probably changed the career path they were going to follow because of us.
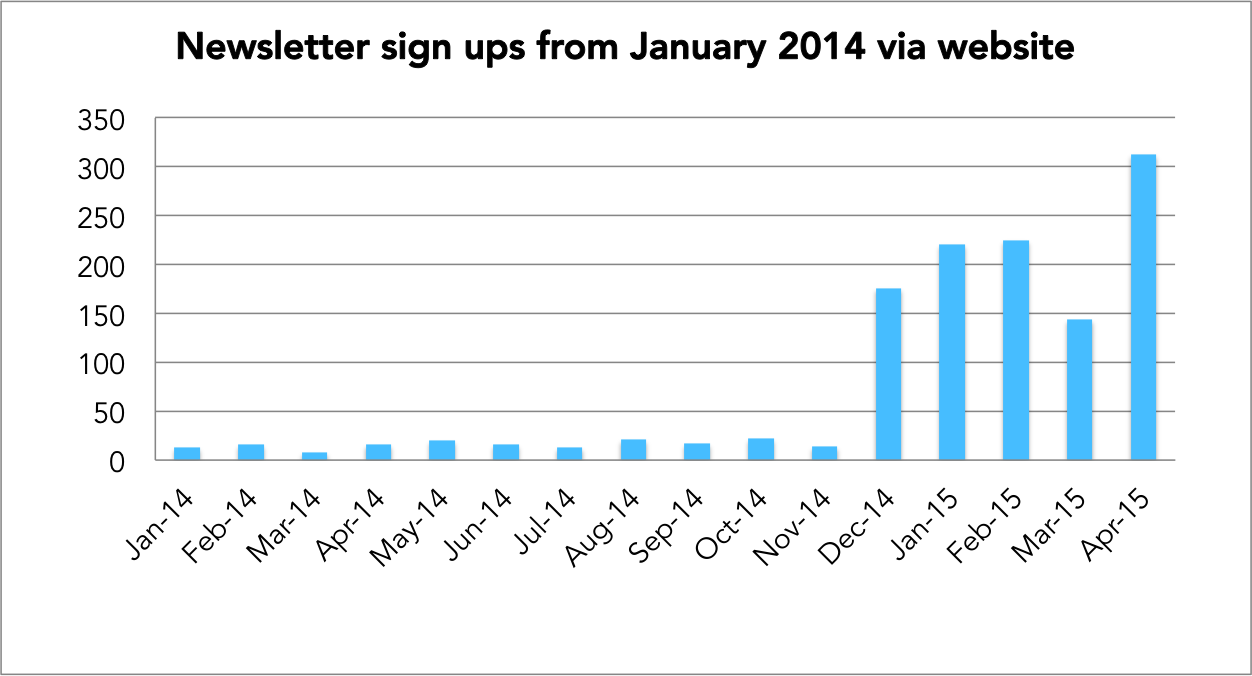
This year, the number of plan changes caused by our online guide rose from about 1.3 per month at the start of 2014 to about 6.5 per month – 400% growth. The rate of newsletter sign ups per month through the website – our key engagement metric – also grew 1600%.
Due to a shift in focus, we coached about a third as many people in 2014 as we had in 2013, and spent less time per person. As a result, significant plan changes caused by coaching declined from 21 in 2013 to 3 in 2014. They picked up again in early 2015 as we increased time spent coaching.
In total to date, we’ve now recorded 188 significant plan changes, up from 107 at the time of our last evaluation in April 2014. We estimate we’re adding about 10 per month at the margin (6.5 from guide, 2 from other (mainly community) and the remainder from coaching), up from 2 per month near the start of 2014.
The average cost per plan change has been decreasing, while this year our estimate of the value of a plan change increased, so we think our historical cost-effectiveness has increased.
Here’s a summary of key figures:
| Year | 2011 | 2012 | 2013 | 2014 | 2015 (ending 30-Apr) | All-time total |
|---|---|---|---|---|---|---|
| Reach: Unique visits to site | 4,266 | 46,924 | 91,999 | 149,164 | 84,928 | 373,252 |
| YoY growth rate | NA | 1000% | 96% | 62% | 110% | NA |
| New significant plan changes recorded (at end of year) | NA | NA | 37 | 81 | 70 | 188 |
| YoY growth rate | NA | NA | NA | 119% | 180% | NA |
| Significant plan changes attributable to online content | NA | NA | 1 | 38 | 46 | 85 |
| Significant plan changes attributable to coaching | NA | NA | 22 | 3 | 8 | 33 |
| Significant plan changes attributed to other (mainly community) | NA | NA | 14 | 40 | 16 | 70 |
| Financial costs | 0 | £23,171 | £124,008 | £119,326 | £46,900 | £313,405 |
| Labour costs (in person-weeks) | 78 | 159 | 351 | 231 | 78 | 871 |
| Total financial costs to date divided by total plan changes | NA | NA | £3,978 | £2,259 | £1,667 | £1,667 |
In the rest of the report, we present:
- Full metrics for (i) the online guide and (ii) the coaching service, with some qualitative comments on key changes.
- An overview of our costs and cost-effectiveness for the year.
Note: “YoY growth rate” stands for “year-on-year growth rate”. To calculate it for Jan-April 2015, we compare to Jan-April 2014.
£1 = $1.5 throughout.
Table of Contents
Online guide performance

| Year | 2011 | 2012 | 2013 | 2014 | 2015 (ending 30-Apr) | All-time total |
|---|---|---|---|---|---|---|
| Reach: Unique visits to site | 4,266 | 46,924 | 91,999 | 149,164 | 84,928 | 373,252 |
| YoY growth rate | NA | 96% | 62% | 110% | NA | |
| Engagement: Newsletter sign-ups through website | 81 | 122 | 311 | 352 | 903 | 1769 |
| YoY growth rate | NA | 155% | 13% | 1604% | NA | |
| Conversion rate (vs. unique visits) | 1.9% | 0.26% | 0.34% | 0.24% | 1.1% | 0.5% |
| New recorded significant plan changes attributable mainly to online content | NA | NA | 1 | 38 | 46 | 85 |
| Conversion rate (vs. newsletter sign-ups) | 0.32% | 10.8% | 5.1% | 4.8% | ||
| YoY growth rate | NA | NA | 3700% | 341% | NA |
See more detailed monthly metrics for the online guide.
How did reach change?
The website’s reach went through several stages:
- It grew at the start of 2014 due to the release of important new content on the blog, such as our top careers list.
- It was flat during the middle of the year since we were focused on the annual review, coaching, several summer conferences, and writing the online guide. At this point we had two or fewer staff members working on our programs.
- It grew rapidly from Sept 2014 into 2015 due to (i) the release of the online guide (ii) us starting to use our free Google AdWords grant (iii) some promotion in early 2015 (e.g. a TEDx talk, more frequent blog posts and an endorsement by Cal Newport).
Newsletter sign-ups
Newsletter sign-ups through the website is our key leading metric for the online content. We think it predicts future plan changes because it indicates substantial interest and allows us to email a request to fill out our impact survey. We increased our conversion to the newsletter four-fold near the end of 2014, mainly due to the launch of a new website appeal. Combined with greater traffic to the site, in 2015 so far we’ve received 225 sign-ups per month, up from 13 in early 2014, 1600% growth.
The quality of our advice
We think we made major improvements to the quality of our advice available on the website. In March 2014, we only had the blog and one static page, which gave a quick summary of some of our key ideas. Now we have an online career guide with over 20 pages of advice, clear navigation and 16 new career profiles. It was first released in September and has been through two further iterations.
While writing the guide, we refined many of our key ideas (e.g. adding exploration value to the career framework, thinking through the cause framework in a lot more depth, and refining the how to choose process). We also prepared new research on giving now vs. later, how much to keep your options open, and replaceability.
In addition to the guide, over the year we published 16 interviews, a medium-depth profile on consulting an overview of cause prioritisation, several pieces on tech entrepreneurship (including one post that was on the top of Hacker News), the earnings of doctors and whether to do a degree. We also prepared significant unpublished research on tech entrepreneurship, software engineering, biomedical research and several other paths.
Significant plan changes due to online content
The monthly rate of significant plan changes due to our online research is up from about 1.3 in early 2014 to 6.5 per month in early 2015, 400% growth.
There’s two ways we track these changes. The first is with an on-going survey promoted through our newsletter and a website appeal. We increased the rate of responses from about 3 per month to about 12, largely driven by improving the web appeal.
The second way we track these changes is through the annual impact survey. This year, we asked people to name the main cause of the change, and over 70% said reading our online research. We can’t directly compare with the last survey, but the proportion seemed to be about 50% previously. We think these increases reflect the increased reach and quality of our online content.
Read more about how we track these changes.
Coaching performance
| Year | 2011 | 2012 | 2013 | 2014 | 2015 (ending 30-Apr) | All-time total |
|---|---|---|---|---|---|---|
| Reach: Unique visits to site | 4,266 | 46,924 | 91,999 | 149,164 | 84,928 | 373,252 |
| Number of people coached (in-person only) | NA | 42 | 78 | 28 | 41 | 189 |
| Number of people saying they made *some* change to their plans after coaching this year | NA | 7 | 29 | 5 | 20 | 61 |
| New significant plan changes attributable mainly to coaching in this year | NA | NA | 22 | 3 | 8 | 33 |
| Conversion rate (of total # coached) | NA | NA | 28% | 11% | 20% | NA |
| New members of alumni group | NA | NA | NA | 100 | 20 | 120 |
See more detailed metrics for coaching broken down by cohort.
In 2014, the coaching process was similar to 2013’s short one-on-ones. In early 2015, we released ‘coaching 5.0’, which first requires working through a diagnostic web app followed by email advice or a 30min Skype call. We also made coaching 5.0 available to anyone who paid, whereas previous rounds were decided by competitive application. We did this so we wouldn’t have to spend time processing applications and to test out whether people would pay for our advice.
Coaching volume
We reduced the number of people coached by about two thirds in 2014. This was mainly a deliberate decision to scale down, since our priority was online content and research. I think this decision was vindicated: we increased the rate of plan changes caused by the online content over 400% and this should be an on-going, scalable stream of people.
The number of people coached also decreased because our staff member in charge of coaching was ill for substantial parts of the year. Our target had been to coach 40 people by the end of 2014, but this was missed.
In 2015, we started to spend more time on coaching, and rates returned to roughly 2013 levels.
Significant plan changes due to coaching
We measure significant plan changes due to coaching by sending a feedback form to everyone who receives coaching, using a similar method to our annual impact survey.
The conversion rate to recorded significant plan changes also decreased from about 28% in 2013 to 11% in 2014. This is mainly because we invested less time per person – in 2013 many of the people we coached were ‘case studies’ and we spent over 20 hours per person, whereas in 2014 we only spent about three hours per person. Quality of service was also reduced by slow responses on our part, which was a mistake we cover in our review of progress. It may also have become harder to produce plan changes in coaching because our online content is better, so coachees have already heard our key ideas.
The overall result was only three new significant plan changes due to coaching over 2014, compared to 22 in 2013.
In early 2015, the conversion rate returned to over 25%. This coincided with the launch of coaching process 5.0. The new process allows us to cover significantly more ground in one hour of coaching time rather than three. The coachee now prepares by first completing the web tool , which allowed us to cut one coaching meeting per person. The improved online guide also saves significant time, since people can read the articles rather than have us explain in-person. In addition, in coaching 5.0 we reduced wait times to under a week and Will and I delivered most of the coaching.
The alumni group
We set this up in late 2014. It’s a group of the 120 most engaged people who have been through our coaching process or reported significant plan changes in our survey. We’ve been using it to share job opportunities and several people have received mentoring on job applications.
Historical costs
Financial costs fell by £5,000 from £124,000 in 2013 to £119,000 in 2014. Time invested fell by 130 weeks (37%) from 351 person-weeks in 2013 to 206 in 2014. Time invested fell much faster than financial costs because we aggressively reduced the number of interns and volunteers, in some cases replacing them with a smaller number of professional freelance time.
Financial costs in early 2015 were significantly higher due to (i) higher staff salaries (ii) adding Peter as a full-time staff member.
See more detail on financial metrics in our finance report.
Time allocation over 2014
We surveyed team members and how many hours they had worked for 80,000 Hours over 2014. In some cases we estimated the totals instead. We didn’t include very small contributions.
| Weeks of full-time work | Percentage of total | Main activities | |
|---|---|---|---|
| Staff member | |||
| Ben | 52 | 23% | Management (inc strategy + fundraising), creating online career guide, evaluation, coaching |
| Roman | 44 | 19% | Coaching, online content, misc (e.g. strategy, recruitment) |
| Peter and Ozzie | 26 | 11% | Website (also systems, other technical) |
| Operations staff and interns | 62.5 | 27% | Operations (finance, fundraising, office, running central CEA) |
| Other staff/interns working on written content (mainly trial work) | 12 | 5% | Blog posts and web pages |
| Virtual assistant for Ben | 4 | 2% | |
| Trustees | 30 | 13% | 24 weeks was Will’s time writing the book |
Very roughly, the key uses of time were:
| Use of time | Weeks of full-time work (rough estimate) | Percentage of total |
|---|---|---|
| Online guide and content | 66 | 28% |
| Book writing | 24 | 10% |
| Coaching | 17 | 7% |
| Operations | 75 | 32% |
| Management, strategy, evaluation | 37 | 16% |
| Other | 13 | 6% |
As of May 2015, the team consisted of:
- Myself as Executive Director.
- Will working on content and promotion.
- Roman working on career profiles.
- Peter as web developer.
- About a 30% share of CEA’s operation team of three.
- Several freelancers.
Opportunity cost of staff time
It’s difficult to estimate the opportunity cost of the time going into 80,000 Hours. One way to make a lower bound estimate is to consider how much each team member would have donated to GiveWell recommended charities if they were earning to give instead.
We asked most of the team members to make an estimate, and from this, we arrived at total opportunity costs of £77,000 over 2014.
This is an average of £351 per week. If we use this figure for staff in 2012-2013 as well (which we’d expect to be an overestimate, since in the past our earning potential was lower), and the estimate we made last year for our opportunity costs in 2011 (when we were still a voluntary organisation), the total opportunity costs are as follows:
| Year | 2011 | 2012 | 2013 | 2014 | Jan-15 to April-15 (preliminary) | Total |
|---|---|---|---|---|---|---|
| Financial costs/£ | 23,000 | 124,000 | 117,000 | 46,900 | 310,900 | |
| Total weeks spent on 80k | 78 | 159 | 351 | 231 | 78 | 897 |
| Estimate of opportunity cost of time/£ of donations to GiveWell recommended charities | 55,809 | 123,201 | 81,081 | 27,378 | 287,469 |
This is highly approximate, but it shows that the opportunity costs of team member time are at least similar to, and perhaps somewhat greater than our financial costs.
Other costs
We don’t pay Will salary, so his costs don’t appear on our financial statement, though we’ve included time he spent on 80,000 Hours above.
We also received discounted services from several companies and $10,000 of free Google AdWords from September. The value of these gifts haven’t been included above.
Cost-effectiveness
Cost per plan change
If you divide total costs incurred to date by the total number of significant plan changes to date, it shows a declining trend.
| Year | 2011 | 2012 | 2013 | 2014 | 2015 (ending 30-Apr) | All-time total |
|---|---|---|---|---|---|---|
| New significant plan changes recorded (at end of year) | NA | NA | 37 | 81 | 70 | 188 |
| Financial costs | 0 | £23,171 | £124,008 | £119,326 | £46,900 | £313,405 |
| Labour costs (in person-weeks) | 78 | 159 | 351 | 231 | 78 | 871 |
| Total financial costs to date divided by total plan changes | NA | NA | £3,978 | £2,259 | £1,667 | £1,667 |
Cost-effectiveness
We made detailed cost-effectiveness estimates in our last annual review, which found that historical impact from plan changes had exceeded costs.
Over the last year, cost per plan change has decreased, while it seems like the expected value of a plan change has increased. This means we think our cost-effectiveness has increased, so we did not perform another detailed evaluation this year.
Why do we think the expected value of a plan change has increased?
1. Donations per plan change have increased. One of the key inputs into our value of a plan change estimates is how much extra money plan changers intend to donate to charity. Last year, the five largest donors estimated they would give an extra £700,000 to high-impact charities within the next three years due to 80,000 Hours, which amounts to £6,500 per plan change. This year, the largest ten donors estimate they will donate an extra £6.9m within the next three years, which is £37,000 per significant plan change (and this excludes the largest donor who didn’t report figures due to anonymity concerns). This represents 470% growth since last year in the value of donations per plan change. The increase was due to a new large donor and a large increase in estimate from an existing donor.
2. Five nonprofits have been founded. We did an evaluation of new organisations founded in part due to us. We found that in total five new professional nonprofits have been founded that likely wouldn’t exist without us, which now collectively have a budget larger than our own. There have also been three voluntary nonprofits and two startups founded.
3. The plan changers are having impact in other ways besides earning to give and founding nonprofits. The above two estimates only concern about 20% of significant plan changes, however, we think the other 80% are also having considerable impact. For instance, some have begun careers in research or politics, or are investing in their skills, which could result in a large impact in the future.
4. We’re giving better advice. The quality of our advice has improved (as explained above) making us more confident that the advice we’re giving people is better than what they would have received otherwise, and thus results in greater impact.
5. Our community continues to get stronger. We still don’t know any cases of people “dropping out” and giving up on trying to have a high-impact career.
It’s hard to quantify the value of a plan change, but we’re confident their value far exceeds their costs.