

Is it fair to say that most social programmes don’t work?

Image courtesy of A&ETV Beyond Scared Straight. Learn more about the effectiveness of Scared Straight.
Lots of government and charity programmes aim to improve education, health, unemployment and so on. How many of these efforts work?
The vast majority of social programs and services have not yet been rigorously evaluated, and…of those that have been rigorously evaluated, most (perhaps 75% or more), including those backed by expert opinion and less-rigorous studies, turn out to produce small or no effects, and, in some cases negative effects.
This estimate was made by David Anderson in 2008 on GiveWell’s blog. At that time, he was Assistant Director of the Coalition for Evidence-Based Policy.
This has become a widely-quoted estimate, especially in the effective altruism community, and often gets simplified to “most social programmes don’t work”. But the estimate is almost ten years old, so we decided to investigate further. We spoke to Anderson again, as well as Eva Vivalt, the founder of AidGrade, and Danielle Mason, the Head of Research at the Education Endowment Foundation.
We concluded that the original estimate is reasonable, but that there are many important complications. It seems misleading to say that “most social programmes don’t work” without further clarification, but it’s true that by focusing on evidence-based methods you can have a significantly greater impact.
We’ll go through the estimates made by Anderson, Vivalt and Mason in turn, discuss the complications, and try to reach an overall conclusion at the end.
Table of Contents
David Anderson’s updated estimates
David Anderson is now Director of Evidence-Based Policy at the Laura and John Arnold Foundation, a multibillion dollar charitable foundation. We reached out to him, and he had some bad news:
If anything, the percentage of programs found to have weak or no effects when rigorously evaluated may even be a bit higher than 75%.
He went on to explain:
I originally gave that quote to GiveWell as a rough estimate based on our organization’s review of hundreds (now probably thousands) of randomised controlled trials conducted across various areas of social policy. Since making that estimate, we’ve looked at this question a little bit more systematically.
In 2015, the Arnold Foundation published a survey of the literature on programmes that had been tested with randomised controlled trials (RCTs) as part of a request for funding proposals. It found the following:
Education: Of the 90 interventions evaluated in RCTs commissioned by the Institute of Education Sciences (IES) since 2002, approximately 90% were found to have weak or no positive effects.
Employment/training: In Department of Labor-commissioned RCTs that have reported results since 1992, about 75% of tested interventions were found to have found weak or no positive effects.
Medicine: Reviews have found that 50-80% of positive results in initial (“phase II”) clinical studies are overturned in subsequent, more definitive RCTs (“phase III”).
Business: Of 13,000 RCTs of new products/strategies conducted by Google and Microsoft, 80- 90% have reportedly found no significant effects.
The current pace of RCT testing is far too slow to build a meaningful number of proven interventions to address our major social problems. Of the vast diversity of ongoing and newly initiated program activities in federal, state, and local social spending, only a small fraction are ever evaluated in a credible way to see if they work. The federal government, for example, evaluates only 1-2 dozen such efforts each year in RCTs.
What counts as a “weak effect”?
One difficulty with these estimates is that they’re sensitive to the definition of a “significant effect”. Some variables include:
- The bar for statistical significance.
- How large the effect size needs to be relative to the cost.
- How the outcomes are chosen.
Our understanding is that Anderson used the standard 5% significance test for (1), and he told us in correspondence that:
We were focused on fundamental (policy relevant) outcomes drawn from individual RCTs, as opposed to meta-analyses. In terms of the effects themselves, I was basing my estimate to Give Well on the general rule we used at the Coalition to determine if something “worked” – i.e., whether it was found in a well-conducted RCT to produce sizable, sustained effects on important outcomes.
Costs weren’t explicitly considered.
We can also look directly at the IES study mentioned above to see their conditions for inclusion, which are in line with this:
In cases where the study measured intermediate outcomes (e.g., teacher content knowledge) and more ultimate, policy-relevant outcomes (e.g., student achievement), we counted the effect on the ultimate outcomes.
In cases where the study measured both interim and longer-term outcomes…we counted the effect on the longer-term outcomes.
Another issue is how the studies are chosen. If you include lots of studies with too few participants, then the percentage that work will appear to be low, even if most of them do (these are called underpowered studies). In the Arnold Foundation’s review, however, they say that studies were only included if:
Sample was large enough to detect a meaningful effect of the intervention.
Estimates within international development, and meta-analyses vs. RCTs
So far we’ve only talked about estimates for US-based programmes, and we’ve only talked about individual randomised controlled trials rather than meta-analyses — a meta-analysis takes all the existing studies on a programme and combines them, with the aim of providing clearer answers about what works. Eva Vivalt is the Founder of AidGrade, which does meta-analyses of international development interventions, so she was well placed to help.
Vivalt did a couple of quick analyses of their data set of RCTs to show how the statistic depends on the definitions. Note that these are just off-the-cuff estimates and could be revised on further analysis.
To start with:
60-70% of individual RCT results are insignificant.
This is similar to Anderson’s estimate, though a slightly higher percentage work.
However, Vivalt pointed out that it’s an underestimate of the fraction that work, because (i) most studies have too small a sample to pick up the effects (are “underpowered”) and (ii) it includes all outcome measures, including those that aren’t very important.
If we combine the studies by type of intervention (e.g. bednets), and perform a meta-analysis, then:
70-80% of interventions (aggregated up into things like “bed nets”, “deworming”, etc., not individual projects) have at least one positive significant outcome if aggregated using random-effects meta-analysis.
This is now surprisingly high, but this is still not quite the figure we want, because (i) the outcome might not be important and (ii) the effect size might be small relative to cost. Furthermore, if many outcomes are measured but only one is significant, the chances of a false positive are a lot higher, for the reason explained here.
How can we pinpoint which outcomes are important? One option is to look at all the intervention-outcome combinations that were addressed by multiple studies, given that few studies on a type of intervention share outcomes in common. The idea is that if many researchers included the outcome, they probably thought the outcome was important. Restricting attention to those intervention-outcomes shared in common by at least three papers, we find:
60-70% of intervention-outcomes that were studied have insignificant meta-analysis results.
The mean effect size is about 0.1 standard deviations.
Overall, the picture seems similar to Anderson’s estimates, but with a slightly higher fraction working. (They’re also in-line with other data we’ve seen, such as JPAL’s Policy Lessons.) However, we should suspect that a higher proportion of meta-analyses would find significant effects compared to individual RCTs. This is for several reasons:
First, there is probably more positive selection with meta-analyses, since people won’t study an intervention unless they think it works, and meta-analysis relies on pulling together results from multiple studies. Vivalt agrees and thinks that it’s an optimistic estimate of the underlying distribution.
Second, many individual studies are underpowered, and so will show no statistically significant effects. However, if the intervention does actually work, then when you combine all the studies into a meta-analysis you will achieve statistical power and find a positive result.
Third, you could imagine that an intervention is ineffective in most circumstances, but occasionally has strong positive effects. Consider three trials:
- No significant effect.
- No significant effect
- Three units of impact.
Then the proportion of individual RCTs that “work” is only 33%, but if we took an average across the studies, the average impact would be 1 unit. This is a gross simplification of what a meta-analysis would do, but illustrates the basic idea. Zooming out, if you think international development works as a whole, then the more studies we combine, the higher the chance of a positive effect.
A fourth factor might be that a higher proportion of interventions work in international development compared to US social services. If people are poorer, it might be easier to find simple ways to improve their lives that actually work and are large enough to be picked up by studies. In general, we should expect the fraction that “work” to vary by domain.
Finally, Vivalt estimated the fraction of programmes that are tested at all, and made a rough estimate similar to Anderson:
Perhaps only around 1-2% of programmes get evaluated with RCTs.
Meta-analyses of UK education with Danielle Mason
The UK’s Education Endowment Foundation provides a fantastic “toolkit” that summarises the evidence on different UK education interventions, so we can ask the same questions in another domain.
Danielle Mason, Head of Research at the organisation, told us that the toolkit attempts to include all relevant, high-quality quantitative studies:
For each topic in the toolkit we capture all existing English language reviews and studies that meet a certain quality threshold.
Each type of intervention is assessed based on (i) strength of evidence, (ii) effect size and (iii) cost. See how these scores are assessed here.
As of 19 June 2017, there are 34 types of interventions in the “teaching and learning toolkit”, of which 31 had at least one meta-analysis performed on them (i.e. they have a score of at least ⅖ for strength of evidence).
Within that, what fraction of these 31 could be said to “work”? As we’ve said, this depends on the definition you use, since whether something works depends on the ratio of costs and benefits, and there’s no clear dividing line. EEF encourages users to consider the tradeoffs, rather than dividing the intervention-types into those that “work” and “don’t work”. With that said, here are some rough figures for the remaining 31 strands:
- 2 (6%) had negative effects.
- 19 (61%) had an impact score of at least “3 points” (measured in months of progress), which is defined as “moderate effect” in the rubric.
- Of those 19, one was expensive relative to its effect size, so it might be reasonable to count them as “not working”.
- 2 had an impact score of only “2 points”, but were among the cheapest, so it might be reasonable to count them as “working”.
The percentage that work seems surprisingly high, and is perhaps higher than Vivalt’s figures. This is similar to John Hattie’s findings – out of 1,200 meta-analyses within education, he found that the average effect size was 0.4 standard deviations, suggesting that a majority of interventions “work”. However, many of these are not causal interventions. For instance, the top item in Hattie’s list is “teacher estimates of achievement”, which just shows that teachers can predict which students will do well, but doesn’t tell us about how to improve student performance. We would expect the average effect size of the causal interventions to be lower.
That aside, we are not sure why the percentage that work seems higher. It might be that the positive selection effects are stronger in this sample, or that there is more publication bias within education research (as we will come on to).
Other sources to investigate
The Campbell Collaboration does meta-analyses of social programmes and the Cochrane Collaboration does meta-analyses of health interventions. It would be useful to review the proportion of these that are significant, but our rough impression from browsing the database is that about half find insignificant results.
What about the replication crisis?
Even if an RCT finds a positive effect, when another group tries to run the same study (“replicate” the findings), they often find no effect. The fraction that fail to replicate varies by field, but is often in the range of 20-50%.
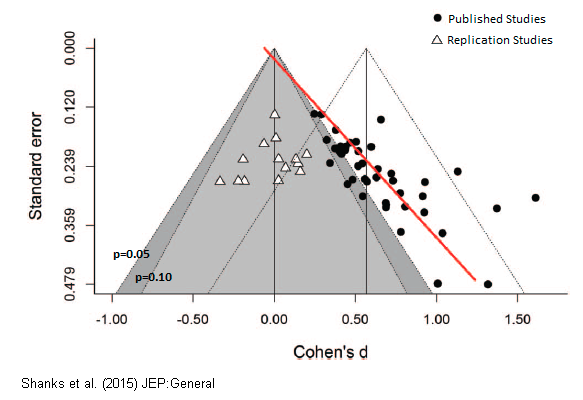
The replication crisis is most severe in subjects like psychology and education research, which could explain the apparently more positive findings in education set out above. In psychology, even findings backed by multiple meta-analysis and expert consensus have later failed to replicate. You can read a popular account of the failure of “ego depletion” studies here. A recent attempt to replicate multiple studies on “romantic priming”, found that the whole effect was likely due to publication bias. The plot below shows that the original studies found an average effect size of 0.5, compared to 0 for the replication studies.
The replication crisis is thought to be happening because existing statistical techniques provide lots of opportunities to increase the apparent significance of the effects, and positive effects are far more likely to be published than negative effects. So, even if you have an RCT showing positive effect, there’s still perhaps a 20-50% chance that the true effect is near zero.
In part for this reason, John Ioannidis famously argued that “most published research findings are false”.
Some more recent work focusing on economics by Ioannidis et al in 2015 found that:
Nearly 80% of the reported effects in these empirical economics literatures are exaggerated; typically, by a factor of two and with one-third inflated by a factor of four or more.
We haven’t made a further adjustment for these concerns in any of our estimates above, so they are probably mostly overestimates.
However, these problems are much less serious if we focus on high-quality studies, and even more so if we use meta-analyses, as we have in many of the estimates. If we suppose that 30% of findings will fail to replicate, then if the proportion that seem to work starts at 35%, it’ll drop to 25%.
What’s more, an upcoming paper by Vivalt and others found that the picture is better in development economics, since the field contains a relatively large number of big studies.1
What can we conclude from all the above?
It’s hard to say what fraction of social interventions “work” because:
- Only a couple of percent are ever rigorously measured, and many studies are underpowered.
- This makes selection effects potentially serious. If researchers tend to study more promising interventions, then the results will paint an overly optimistic picture.
- The proportion that “works” is sensitive to (i) the studies that are included, (ii) the outcomes that are included, (iii) where you draw the line for statistical significance, (iv) where you draw the line for effect size relative to cost, (v) whether you focus on individual studies or meta-analyses, and how broadly you aggregate, and (vi) which area you focus on (e.g. health vs education).
- A significant fraction of this research might not be trustworthy due to the replication crisis (“p hacking”, publication bias, etc).
However, what might some tentative conclusions be about the proportion that are effective?
If we focus on key fundamental outcome measures:
- Of individual projects, when tested with well-powered randomised controlled trials, perhaps over 80% don’t “work”, i.e. deliver a reasonable effect size relative to cost.
- Perhaps 1-10% have negative effects.
- Of intervention types that have been evaluated with meta-analyses, the proportion that don’t “work” is probably lower, perhaps over 60% instead of 80%, but this is partly just because there is more attention paid to the most promising interventions.
- The interventions and projects that haven’t been tested are probably worse, since more research is done on the most promising approaches.
- If you consider whole “areas” (e.g. education as a whole), then the average effect is probably positive. This is what you’d expect if the area is making progress as a whole, and there is some pressure, even if weak, to close down poor programmes. This is consistent with many individual projects failing to work, and a small number of projects having strong positive effects, which is what we might expect theoretically.2
- The average effect size and proportion of interventions that work probably varies significantly by area.
So is it fair to say “most social programmes don’t work?”
I think this is a little ambiguous and potentially misleading. Individual projects mostly don’t work, but whole areas often do have a positive impact. So, if you pick an intervention at random, then on average your impact will be positive, because there’s a small but important chance of you picking one of the good ones.
However, if you can focus on the best interventions in an area according to the evidence, then you can have significantly more impact than the average. For instance, if two thirds of interventions don’t work, then if you can avoid these, you’ll have about three times as much impact as if you work on whatever you first stumble into, and pick randomly.
Given that we also can’t expect our gut instincts to pick accurately, it’s still important to try our best to focus on evidence-based approaches.
How important is it to be “evidence-based”?
That said, the boost of “being evidence-based” isn’t as big as is often made out in the effective altruism community. Suppose 10% of interventions are highly effective, and have 10 units of impact, while 90% don’t work. If you can pick the top 10%, then you’ll have 10 units of impact, while if you pick randomly, then you’ll have:
10% * 10 + 90% * 0 = 1 unit of impact.
So the boost in impact you get from being evidence-based is 10-fold. But, this is an upper bound, because in reality, the other 90% will have some positive impact. Further, your measurements will be imperfect, so you won’t be able to precisely identify the top 10%, further reducing the differences.
In general, the size of the boost from being evidence-based depends on the degree of spread in effectiveness within the area, and how good your measurements are. Global health is probably the best area on these grounds, since we have the most data and there are large differences in cost-effectiveness. But the best interventions in global health are only about ten times more effective than the mean, and the difference will be less after adjusting for measurement error (regression to the mean).
What’s more, it’s possible that the best interventions in an area are not based on current evidence – rather they might involve creating and testing new interventions, or taking a high-risk, high-reward approach like research or policy advocacy. If you only stick to evidence-based methods, you might miss those that are highest-impact. (It depends on whether people are taking too much or too little risk in the area.)
All taken together, a tenfold gain in effectiveness probably represents the maximum you can currently gain from picking evidence-based interventions, and in most areas, it’s probably more like a two or threefold gain.3
To illustrate the importance of being evidence-based, people in the community commonly cite the difference between the best interventions and the worst, or the median. This is an interesting figure, because it gives an idea of the spread of effectiveness, but the alternative to being evidence-based is probably more like picking randomly (at worst), rather than systematically picking the worst interventions (or the median). If you pick randomly, then you have a small chance of picking something highly effective by luck, which means your expected effectiveness is equal to the mean. And you might be able to do even better than picking randomly by using theory or your own experience.
A two to tenfold gain in impact from being evidence-based is, by most standards, a big deal, but it’s much smaller than the boost you can get from picking the right problem area in the first place. We’ve argued using our framework that efforts in some common areas can be expected to be over 100 times more effective than others.
Read next
Among social interventions that are effective, how much better are the best compared to the average? And what does this imply for efforts to do good?
We explore this question in a separate article: How much do solutions to social problems differ in their effectiveness? A collection of all the studies we could find
Or read the next article in our advanced series: How much do people differ in productivity? What the evidence says
Further reading
- What’s the biggest and most urgent problem in the world?
- Our podcasts with Eva Vivalt and Rachel Glennerster
- What is effective altruism?
Notes and references
We find that the large majority of studies in our sample are generally credible.
Coville, A., & Vivalt, E. (2017, August 14). How Often Should We Believe Positive Results? Assessing the Credibility of Research Findings in Development Economics.
Link to preprint.↩- Complex systems often produce “fat tailed” outcomes, where a small number of outcomes are far bigger than the median. For instance, we’ve found that “career success” seems to be like this. (If an outcome is caused by a product of normally distributed factors, then it’ll be log-normally distributed.)↩
- Though in the longer-term, it’s valuable to build a culture that attends to evidence. For instance if you don’t attend to rigorous evidence, then you may (1) be influenced by extravagant claims on areas where data hasn’t been collected, and other factors that cause you to pick worse than randomly, and (2) create incentives to add an unbounded quantity of bad interventions (since any intervention will get its lottery share).↩