

A framework for comparing global problems in terms of expected impact

Suppose you’re trying to figure out whether to learn about health in developing countries; or whether to become a researcher in solar energy; or whether to campaign for criminal justice reform in the USA. Which of these areas is most effective to focus on?
A year’s work on some problems can help a lot more people than a year’s worth of work on other problems. In fact, our analysis suggests that which problem areas you choose to work on may be the single biggest determinant of the social impact you have with your career.
We often make use of an informal framework for comparing problems in terms of their potential for an additional person to have a positive impact: scale, neglectedness, solvability and personal fit. Here’s a popular introduction to the framework.
Applying the informal version of the framework is useful, and good enough for many situations, but it can lead to some issues like double counting. In this article, we outline a more precise, quantitative version of the framework, and give more details on how to apply it to make your own comparisons of areas.
The framework was first created by Coefficient Giving. We further developed this process in collaboration with staff at the Future of Humanity Institute, a former research group at the University of Oxford that advised policy-makers and major decision-makers on how to prioritise global problems (learn more about global priorities research).
This framework is just one tool we use to compare different global problems, and has a number of weaknesses. We discuss some of the pros and cons of this approach compared to qualitative approaches and cost-effectiveness analysis at the end of the article. Here’s a more comprehensive process you can use to compare global issues. If you’re coordinating with a community there are also some further factors to consider.
Table of Contents
- 1 Introducing how we define the factors
- 2 Defining a problem carefully
- 3 Creating a (logarithmic) scale
- 4 How to assess scale
- 5 How to assess how neglected a problem is
- 6 How to assess how solvable a problem is
- 7 What do the summed scores mean?
- 8 How to assess personal fit
- 9 Other factors for comparing career opportunities
- 10 How should we interpret the results?
- 11 How does this approach compare with ordinary cost-effectiveness analysis?
- 12 Advantages and disadvantages of quantitative problem prioritisation
- 13 How to factor in coordination?
- 14 Conclusion
- 15 Further reading
- 16 Read next
Introducing how we define the factors
Ultimately what we want to know is the expected ‘good done’ per unit of resources invested in the problem. A unit of resources could be a year of labour or a dollar of donations, or some other measure.
This is hard to estimate by itself, so we need to break it down into components that we can estimate individually.
In our introductory article, we gave a rough breakdown into some qualitative factors. Here is more precise, quantified version of the same break down:
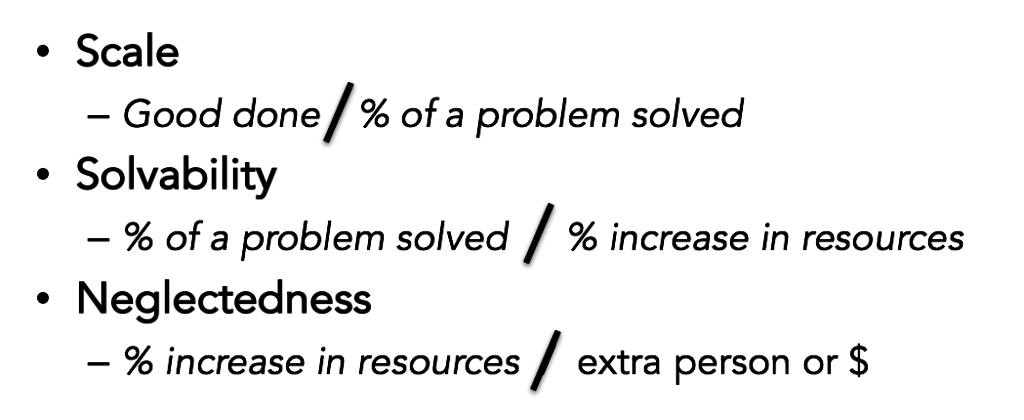
A good reason to do it this way, is that if we multiply these three terms together, we will get back to ‘good done’ / ‘extra person or $’ allocated to the problem:
So, now we’ve broken “good done per $” into three components that each have a quantitative definition. What are these components, in plain English?
- Scale – if we solved the problem, how good would it be?
- Solvability – if we doubled the resources dedicated to solving this problem, what fraction of the problem would we expect to solve?
- Neglectedness – how many resources are already going towards solving this problem?
Finally, if you’re trying to figure out what problem you should work on, you can add bonus points for problems that you are better suited to working on, which we explain in more depth later.
Below we’ll discuss how to assess each in turn, but before that we have a few more remarks on how to set up the analysis.
Defining a problem carefully
Before you go on to make your assessment, make sure you have a clear description of the scope of the problems you want to compare. This will help you to be consistent when scoring each factor. For example, if we were evaluating ‘global health’ we would need to be clear about:
- Which diseases are included (e.g. TB, HIV, Malaria, etc)
- Which countries we are considering (i.e. only the poorest countries, or also middle income countries?)
A challenge of any framework of this kind will be that carefully chosen ‘narrow’ problems tend to do better than broadly defined ones. For example, ‘combating malaria’ will look more pressing than ‘global health’ because malaria is a particularly promising health problem to work on. Similarly, improving health in Kenya is going to look more impressive than improving health in Costa Rica. There’s nothing wrong with these findings – but they could create a misleading impression if a broadly defined problem is compared with a narrowly defined one. If someone were motivated they could make a problem look more or less pressing by defining it differently – and this is something to be aware of in interpreting these scores.
Creating a (logarithmic) scale
If you try to compare different areas using these scores you’ll find they vary hugely. For instance, while about $300bn is spent on global health annually, under $100m is spent trying to tackle factory farming. So, factory farming is over 1,000 times more neglected than global health.
This means it’s more convenient to use a “logarithmic scale” to rate each component. The way we do this is every two points we add to a problem means that it’s 10x more effective. For instance, if we give one problem a neglectedness score of 4 and another of 6, then we mean the second one is 10 times more neglected.
This is like the Richter scale used to measure earthquakes. An earthquake that that’s Richter 8 is actually 10-times more powerful than one that’s Richter 7.
Using a logarithmic scale for each part also means that rather than having to multiply Scale, Solvability and Neglectedness in order to get our overall cost-effectiveness estimate, we can simply add them together. (As the quantitatively inclined among you might recall from high school, this is because log(AB) = log(A) + log(B).)
To make the scores easy to read we put them all on a scale between 0 and 16. For comparisons of cost-effectiveness between different problems, we will just be looking at the difference in score between them.
How to assess scale
Definition
If we solved this problem, by how much would the world become a better place?
For example, cancer is a bigger problem than malaria because it is responsible for 8% of all ill-health worldwide (measured in QALYs lost), whereas malaria is responsible for 2.7% of ill-health worldwide.1 If we got rid of all cancer it would reduce ill-health significantly more than if we got rid of all malaria.
One way to measure the scale of a problem in terms of its effect on wellbeing, because this is something most people care about, and we have tools to allow comparison between different kinds of benefits. (Though we don’t claim wellbeing is all that matters – read more about the definition.)
This means scale can be increased by either (i) affecting a larger number of people (ii) affecting the same number of people in a bigger way, including both short-term and long-term effects. We use a broad notion of wellbeing, so the effect could improve many aspects of someone’s life, including: happiness, health, a sense of meaning, positive relationships, and so on.
In practice, we take a longtermist perspective, so for us, assessing scale comes down to working out which issues have the greatest significance for future generations.
If you have different values from us, you can use the framework with a different definition of scale.
It can also be useful to group instrumental sources of value within scale, such as gaining information about which issues are most important, or building a movement around a set of issues. Ideally, one would also capture the spillover benefits of progress on this problem on other problems. Coordination considerations, as briefly covered later, can also change how to assess scale.
Note that we also defined scale as the good done by solving the whole problem; however, you could also do the analysis with solving 10% of the problem, so long as you do that consistently with the other factors as well.
How to assess it
Sometimes it’s possible to make fairly precisely quantified comparisons of scale, like in the case of cancer vs. malaria above.
However, often this is not the case. This is particularly true when you try to factor in the long-run and indirect effects of solving a problem. Suppose you make a breakthrough in physics – how many people are ultimately going to be affected? It’s hard to say, but we shouldn’t conclude from this that physics breakthroughs don’t matter.
To make more wide ranging comparisons between problems, you need to turn to “yardsticks” for scale. These are more measurable ways of comparing scale that we hope will correlate with long-run social impact.
For instance, economists often use GDP growth as a convenient yardstick for economic progress (although it has many weaknesses). Nick Bostrom has argued that the key yardstick for long run welfare should be whether an action increases or decreases the risk of the end of civilization – what he called existential risk.
Here is one set of yardsticks (on the top row), which we assess with the following rubric:
| If we solved this problem it would be equivalent to: | A reduction in the risk of extinction (or increase in the expected value of the future) of: | Raising global economic output proportionally by this amount per year: | Increase in income among the world’s poorest 2 billion people: | Saving this many years of healthy life each year: | Illustrative Example |
|---|---|---|---|---|---|
| 16 | 10% | Eliminate the risk of both nuclear war and pandemics | |||
| 14 | 1% | $100 trillion | $3 trillion | 1 billion QALYs | Eliminate extreme poverty |
| 12 | 0.1% | $10 trillion | $300 billion | 100 million QALYs | Cure cancer |
| 10 | 0.01% | $1 trillion | $30 billion | 10 million QALYs | Increase aid by a third and spent it on cash transfers |
| 8 | 0.001% | $100 billion | $3 billion | 1 million QALYs | Eliminate land use restrictions in major US cities |
| 6 | 0.0001% | $10 billion | $300 million | 100,000 QALYs | Remove 5 min/day needless red tape for US teachers |
| 4 | 0.00001% | $1 billion | $30 million | 10,000 QALYs | Identify all risky asteroids |
| 2 | 0.000001% | $100 million | $3 million | 1,000 QALYs | Turn 10,000 people vegan |
| 0 | 0.0000001% | $10 million | 300000 | 100 QALYs | Save 3 lives |
This process is most robust when you’re comparing problems that use the same yardstick e.g. comparing several problems in terms of how much they improve health. The tradeoffs across the columns are extremely uncertain, and an active topic of research by groups like the Future of Humanity Institute.
The trade offs across columns are also very sensitive to big worldview and value judgements. People disagree over what most matters to wellbeing, how to value people in the future, and how to value non-humans. For example, some people believe that general economic growth is not good at all, because of unintended side effects (e.g. climate change, or the more rapid invention of dangerous new technologies). (This tool leads you through some of the most important judgement calls.)
The rubric above reflects our own considered judgement calls at how to trade different yardsticks against each other. We don’t fully explain our reasoning, which is hard to make explicit. Read more about how to choose a yardstick and also see Crucial Considerations and Wise Philanthropy by Nick Bostrom. (Unfortunately, this article and our choice of yardsticks are not fully up-to-date with our latest thinking, though the broad ideas and direction are still correct.)
If a problem helps with several columns, then focus on the column where the problem has the largest effect. Since each row corresponds to a factor of ten, the top rows will dominate the overall assessment of scale.
How to assess how neglected a problem is
Definition
How many people, or dollars, are currently being dedicated to solving the problem?
Why is it important?
After a large amount of resources have been dedicated to a problem, you’ll hit diminishing returns. This is because people take the best opportunities for impact first, so as more and more resources get invested, it becomes harder and harder to make a difference. It’s therefore often better to focus on problems that have been neglected by others.
For instance, mass immunisation of children is an extremely effective intervention to improve global health, but it is already being vigorously pursued by governments and several major foundations, including the Gates Foundation. This makes it less likely to be a top opportunity for future donors.
It’s also valuable to explore new problems because this can help us figure out which problems are in fact most pressing. That is to say, there is an additional ‘value of information’ from trying new things. If no-one has worked on a problem before, then it could easily turn out to be more solvable than is currently thought.
There are some mechanisms by which problem areas can see increasing returns rather than diminishing returns. However, we think there are good theoretical and empirical arguments that diminishing returns are the norm, and that returns most likely diminish logarithmically. Increasing returns might hold at very small scales within problem areas, though we’re not even sure about that due to the value of information benefits mentioned above. (Increasing returns seem more likely to be common within organisations rather than problem areas.)
Also note that neglectedness is only a good proxy if the area is being neglected for bad reasons by other actors. However, we think that society’s mechanisms for doing good are far from efficient, so all else equal, neglectedness is a good sign.
One particularly important way that a problem can end up neglected for bad reasons is if other people simply don’t value it. This article argues that if you care about something X times more than the average person, you should expect to be able to have X times as much impact by working on that area (by your lights). For instance, we think that the interests of future generations are dramatically undervalued by society, so by working on issues that aid future generations, we can have far more impact.
How to assess it
| Crowdedness Score | What is the direct annual spending on the problem? | What is the number of full time staff working on the problem? | What is the number of active supporters of work on the problem? |
|---|---|---|---|
| 12 | $100,000 or less | 1 or less | 1,000 or less |
| 10 | $1 million | 10 | 10000 |
| 8 | $10 million | 100 | 100000 |
| 6 | $100 million | 1000 | 1 million |
| 4 | $1 billion | 10000 | 10 million |
| 2 | $10 billion | 100000 | 100 million |
| 0 | $100 billion | 1 million | 1 billion (i.e. everyone) |
A challenge – direct vs. indirect & future effort
Often resources are unintentionally dedicated to solving a problem by groups that may be self-interested, or working on an adjacent problem. We refer to this as ‘indirect effort’, in contrast with the ‘direct effort’ of groups consciously focused on the problem. These indirect efforts can be substantial. For example, not much money is spent on research to prevent the causes of ageing directly, but many parts of biomedical research are contributing by answering related questions or developing better methods. While this work may not be well targeted on reducing ageing specifically, much more is spent on biomedical research in general than anti-ageing research specifically. Most of the progress on preventing ageing is probably due to these indirect efforts.
Indirect efforts are hard to measure, and even harder to adjust for how useful they are for solving the problem at hand.
For this reason we usually score only ‘direct effort’ on a problem. Won’t this be a problem, because we will be undercounting the total effort? No, because we will adjust for this in the next factor: Solvability. Problems where most of the effective effort is occurring indirectly will not be solved as quickly by a large increase in ‘direct effort’.
One could also use a directed-weighted measure of effort. So long as it was applied consistently in evaluating both Neglectedness and Solvability, it should lead to roughly the same answer.
Another challenge is how to take account of the fact that some problems might receive much more future effort than others. We don’t have a general way to solve this, except (i) it’s reason not to give extremely low neglectedness scores to any area (ii) one can try to consider the future direction of resources rather than only resources today.
More tips on how to assess
Rather than trying to assess neglectedness directly, you can also consider rules of thumb like the following. These help you to work out how neglected it is and whether it’s being neglected for bad reasons.
- Is there any reason to expect this problem not to be solved by: (i) markets (ii) government (iii) other individuals looking to have a social impact?
- Within research, is this a new field, or at the intersection of two disciplines? These areas are most likely to get neglected by academia. (Read more about choosing a research topic.)
- If you don’t work on the problem, how likely is it someone else will step in instead?
- If you work on this problem, will you learn more about how pressing it is compared to other problems?
Thinking through these questions can increase your confidence you haven’t missed anything in your estimate.
Note that it’s important to assess scale and neglectedness as a pair. Ultimately we care about the ratio of the two, so you need to make sure you’re assessing the same problem in both cases. If you use a different definition of the problem in each case, it will throw off your results.
If several different kinds of input are being dedicated to a problem, use the column with the lowest score. That will be where most of the total resources are: e.g. if $10bn per year is invested in a problem and 1,000 full-time people work on it, then the money dominates, so the score is 4, not 6.
Finally, we are reluctant to give very high scores for neglectedness. Even obscure problems usually attract the attention of some group in the world, and we may simply not know about them. So unless we’ve done a comprehensive search to show otherwise, we will assume that at least $1 million is being directed towards a problem.
How to assess how solvable a problem is
Definition
If we doubled direct effort on this problem, what fraction of the remaining problem would we expect to solve?
Why is it important?
Even if a problem is hugely important and highly neglected, that doesn’t mean it’s an important cause to focus on. There might simply be very little we can do about it.
For example, ageing is a problem that is huge in scale: almost two thirds of global ill health is a result of ageing in some way. It’s also highly neglected: there are only a tiny number of research institutes focused on trying to prevent the causes of physical ageing (rather than to treat its symptoms, like cancer, stroke, Alzheimer’s, and so on). However, one reason it’s neglected is because many scientists believe it to be very hard to solve, which is a major reason against working on the problem right now (though its other advantages could be enough to offset this downside).
How to assess it
We use this rubric:
| Solvability score | The doubling of the direct effort described in ‘Neglectedness’ would be expected to solve this much of the problem (defined in Scale): |
|---|---|
| 8 | 100% |
| 6 | 10% |
| 4 | 1% |
| 2 | 0.1% |
| 0 | 0.01% |
Some rules of thumb we consider include:
- Are there cost-effective interventions for making progress on this problem with rigorous evidence behind them? (ideally high up the hierarchy of evidence).
- Are there promising but unproven interventions that can be cheaply tested?
- Are there theoretical arguments that progress should be possible, such as a good track record in a related area? (e.g. we can’t prove that medical research will be effective ahead of time, but the area has a strong track record, and rough estimates suggest it’s very effective).
- Are there interventions that could make a huge contribution to solving the problem, even if unlikely to work?
In general, we’re looking to find the best interventions to make progress on the problem, then evaluate them based on (i) potential upside (ii) likelihood of upside. We consider all forms of evidence, from rigorous trial data and speculative arguments. We take a Bayesian approach to evaluating both factors – our prior is that the intervention isn’t very effective, then we update away from that depending on the strength of the evidence (see an example). Read more about making these kinds of estimates.
Challenges in assessment
This is typically the hardest of the three factors to score because it requires anticipating the future, rather than simply measuring things that currently exist.
In some cases, you can estimate solvability based on the cost-effectiveness of existing techniques in a field. For example, we have a sense of how many lives would be saved by increasing spending on global health interventions based on past experience tackling HIV, malaria, tuberculosis and so on.
In other cases – where solving a problem requires innovative techniques – the scores are usually assigned based on judgement calls, ideally based on a survey of expert opinion.
Some approaches to solving problems are incremental (e.g. distributing bednets to reduce exposure to malaria-carrying mosquitoes); others offer some chance of solving a lot of the problem all at once (e.g. inventing a new malaria vaccine). For scoring we use the ‘expected value’ approach. That is, a 10% chance of solving all of a problem is scored the same as a project that would definitely reduce it by 10%. (While ‘risk aversion’ about different outcomes means that these aren’t necessarily equally valuable, it’s a good approximation.)
As discussed above in Neglectedness, problems for which most of the work is being performed indirectly (e.g. by for-profits doing related things) will likely be solved more slowly through an increase in ‘direct’ work. This is because many promising approaches will already have been attempted by other groups.
What do the summed scores mean?
To do a sanity-check we can add these scores and convert them back into a measure of actual impact from one additional person working on a problem:
| If the problem has this score: | One extra person working on a problem... | One extra person working on a problem... |
|---|---|---|
| 28 | Saves 1 million QALYs per year | Reduces existential risk by 0.001% |
| 24 | Saves 10,000 QALYs per year | Reduces existential risk by 0.00001% |
| 20 | Saves 100 QALYs per year (2 lives) | Reduces existential risk by 0.0000001% |
However, these figures are extremely approximate, so we don’t recommend putting weight on them specifically. Rather, we prefer to use the scores to make relative comparisons rather than absolute estimates.
How to assess personal fit
While personal fit is not assessed in our problem profiles, it is relevant to your personal decisions. If you enter an area that you find totally demotivating, then you’ll have almost no impact. Within a field, the top performers often have 10 to 100 times as much impact as the median.
If you are comparing different problems you can use these extra scores to give a bonus to problems you are well suited to tackling.
Definition
Given your skills, resources, knowledge, connections and passions, how likely are you to excel in this area?
How can it be assessed?
- What’s your most valuable career capital? Is it especially relevant to one problem and not the others?
- How motivated do you expect to be if you worked on this problem?
- What specific roles could you take in this problem, and do you expect you’d excel at them?
Here’s our introductory advice on how to assess personal fit, and some further questions for making predictions.
Here’s a rubric you could use:
| Personal fit score | How well matched are your skills for this area? |
|---|---|
| 4 | You are exceptionally well-suited to the area. You are well-motivated and could be a world-leader in the field. |
| 2 | You are a reasonable fit for the field. Quite motivated and some relevant skills. |
| 0 | You are an actively bad fit for this field because you couldn’t be motivated to work on it or have no relevant skills. |
Note that the importance of personal fit depends on how you’re planning to contribute. A great entrepreneur or researcher has far more impact than an average one, so if you’re planning to contribute in either of those ways, personal fit matters a lot. However, if you’re earning to give, personal fit is less relevant because you’re sending money rather than your unique skills. So to assess personal fit in more depth, you could estimate your percentile in the field, then multiply by a factor that depends on the variation of performance in the field.
Bear in mind that it’s easy to underestimate the extent to which you can become knowledgeable and passionate about a new problem. We’re biased towards continuing with what we’ve done before—the ‘sunk cost fallacy’—and we underestimate how much our preferences and passions will change.
Finally, remember that a single problem can often be tackled in multiple ways. If you want to work on global health, you could work on the ground in the developing world, conduct biomedical research, go into politics and many other options besides. If one isn’t a good fit for you, another might be.
Other factors for comparing career opportunities
To come to an all considered view on whether to take a job, you also need to consider the other factors in our career framework, such as:
- How influential a role you can get.
- How much career capital you can get.
- The value of information of working on this option.
In this article, we only cover comparisons of problem areas, but that’s not all that’s relevant.
How should we interpret the results?
If you’ve used our rubric above, you can add the scores together to get a rough answer of which problem will be more effective to work on.2 Bear in mind that these scores are imprecise, and adding them increases the uncertainty even further, because we only measure each one imprecisely. This means you need to take your final summed score with a grain of salt – or rather a lot of salt.
Within 80,000 Hours, if the difference in score between two problems is 4 or larger, we have a reasonable level of confidence that it’s a more effective problem to work on. If the difference is 3 or smaller it looks more like a close call.
The scores we get when using this framework suggest that some problems are 10,000x more effective to work on than others. However, we don’t believe that the differences really are that large. For one, our scores have to be tempered by common sense judgements about the world. If the score for one problem seems very high, then it’s possible we’ve simply made a mistake and don’t realise it. For two, because the future is so unpredictable, work on problems that don’t seem pressing could turn out to be very useful in unexpected ways. That puts a limit on how much more pressing one problem can be than another.
Some other reasons for being modest about what such prioritisation research can show us are discussed here.
For more tips on making difficult judgement calls, take a look at our checklist.
How does this approach compare with ordinary cost-effectiveness analysis?
What we want to know is this: ‘if I add an additional unit of resources to solving this problem, how much good will be accomplished’? The approach above looks at a problem from a bird’s eye view, and tries to assess how important it is to allocate more resources to solving it.
An alternative approach would be to look at the cost-effectiveness of past interventions to tackle different problems, and compare them directly against one another. For example, you could look at studies of different approaches we know about to improve education or health, and then calculate which one would help people more with an additional $1 million in funding. If this kind of cost-effectiveness data is available, and you already have a common outcome, this is a sensible approach. For instance, in health economics, people often calculate “QALYs per dollar” for different interventions.
If you’re comparing two problems that use different yardsticks, you can still compare them so long as you have a conversion factor, though the comparisons become much more uncertain. For instance, you could compare health interventions to climate change interventions by defining the rate at which you’d trade 1 QALY for 1 tonne of carbon dioxide averted. Our rubric in the scale section above shows roughly how we’d trade some yardsticks against others.
Alternatively you can try to convert all the benefits into dollar terms, and perform a ‘cost-benefit analysis‘. This is expressed as a ratio of costs to benefits, both in dollars.
The main reason not to take this approach is that it’s extremely hard in many cases:
- Political advocacy, in which the circumstances you are working with are constantly shifting.
- Original research, where no-one knows how long it will take to make a new discovery.
- Any field in which no interventions are known, or the ones that we know about are not well studied.
It’s for this reason we have created the alternative framework above that can be applied to almost any problem.
Advantages and disadvantages of quantitative problem prioritisation
There are several benefits to going through the process above:
- Explicitly quantifying outcomes can enable you to notice large, robust differences in effectiveness that might be difficult to notice qualitatively, and help you to avoid scope neglect.
- Going through the process of making these estimates is a great way to test your understanding of a problem, since it forces you to be explicit about your assumptions and how they fit together.
- A clearly laid out analysis can help others to understand and critique your reasoning, further helping you to understand the problem and how pressing it is.
But there is a major downside we need to keep in mind:
- In practice, these types of estimates usually involve very high levels of uncertainty. This means their results are not robust: different assumptions can greatly alter the conclusion of the analysis. As a result, there is a danger of being misled by an incomplete model, when it would have been better to go with a broader qualitative analysis, or simple common sense.
This is why we don’t simply go with the results of our scores. Rather, we consider other forms of evidence in our problem profiles to make an overall assessment.
For more on this topic, see GiveWell’s discussion of the weaknesses of ‘sequence thinking’ (which corresponds to an approach that’s heavily reliant on cost-effectiveness analysis) compared to ‘cluster thinking’. You can also see a discussion of the pros and cons of quantification.
How to factor in coordination?
An individual can only focus on one or two areas at a time, but a large group of people working together should most likely spread out over several.
When this happens, there are additional factors to consider when choosing a problem area. Instead of aiming to identify the single most pressing issue at the margin, the aim is to work out:
- The ideal allocation of people over issues, and which direction that allocation should move in.
- Where your comparative advantage lies compared to others in the group.
We call this the ‘portfolio approach’. Read more.
Factoring in coordination can also have other effects on which problems to prioritise. For instance, it can be worth doing more work on an area than it first seems in order to compromise with or do moral trade with the other people you’re coordinating with. Read more.
Conclusion
We’ve shown how to compare different problems on each of our framework factors – scale, neglectedness, solvability and personal fit.
While it is hard to measure effectiveness precisely, the differences identified between problems are often very large. This suggests that even inaccurate measurements could be a useful guide, compared to relying on intuition alone.
Want to help solve a pressing problem?
If you’re interested in pursuing a career focusing on one of the world’s most pressing problems, our team might be able to speak with you one-on-one. We can help you consider which problems to prioritise. We can also help you consider your options, make connections with others working on the same issue, and possibly even help you find jobs or funding opportunities.
Further reading
- Crucial considerations and wise philanthropy
- Take the portfolio approach to maximizing impact as a community.
Read next
This is a supporting article in our foundations series. Read the next article in the series, or here are some others you might find interesting:


Notes and references
- Data from the Global Burden of Disease 2013.
- The three factors multiply together i.e. ten times the scale means the problem is about ten times more pressing. The rubric, however, uses a log scale, so you need to add the scores. (Because log(ABC) = logA + logB + logC).↩