

Metrics Report
NOTE: This piece is now out of date. More current information on our plans and impact can be found on our Evaluations page.
Metrics Report
This is the second post (of a series of six) on our six month evaluation
This post outlines the key outreach and community metrics that we track week-to-week.
Web Traffic
The chart below shows the number of unique visitors to our website each month (i.e. each visitor is only counted once).
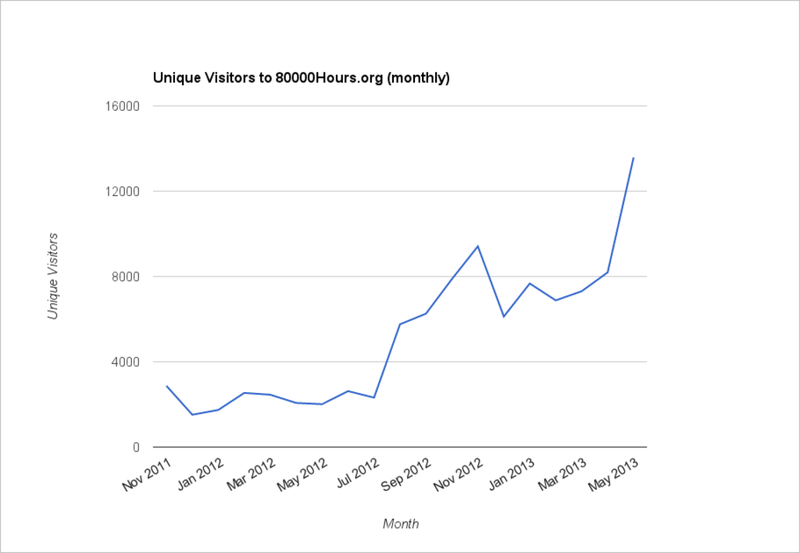
In the 6-month period from December 2012 to May 2013, we received 47,144 unique visitors. In the previous 6 months, we received 32,031 unique visitors. This represents a 47% increase.
Sources of Web Traffic
The table below shows our sources of web traffic in the most recent 6 months and in the previous 6 months, as well as the difference between these periods.
| Source | Dec 2012 – May 2013 | Jun 2012 – Nov 2012 | Increase | % Increase |
|---|---|---|---|---|
| Referral | 30,179 (39%) | 26,888 | 3,291 | 12% |
| Search | 27,889 (37%) | 11,434 | 16,455 | 140% |
| Direct | 18,002 (24%) | 10,052 | 7,950 | 79% |
Major Referral Domains
Below are the top 5 referral domains in the last 6 months and the previous 6 months.
| Top Referral Domains Dec 2012 – May 2013 | Visitors | Top Referral Domains Jun 2012 – Nov 2012 | Visitors |
|---|---|---|---|
| facebook.com | 14,188 | reddit.com | 9,081 |
| reddit.com | 3,083 | facebook.com | 9,456 |
| qz.com | 1,615 | lesswrong.com | 1,297 |
| blog.ted.com | 705 | overcomingbias.com | 935 |
| lesswrong.com | 698 | t.co | 618 |
Geographical Location
37.61% of visits came from the United States.
29.28% came from the United Kingdom.
Top Blog Posts
Our 5 most popular blog posts for the period were:
* “Our Research on How to Find a Job You Love” (2,815 views)
* “A Formula for the Perfect Job” (2,621 views)
* “Two Question You Won’t Want to Ask Yourself but Should” (2,255 views)
* “How Many Lives Does a Doctor Save?” (1,815 views)
* “How to Make a Difference in Research: an Interview with Nick Bostrom” (1,294 views).
“Our Research on How to Find a Job You Love,” and “How Many Lives Does a Doctor Save?” weren’t written in this period, but continue to pick up significant amounts of search traffic.
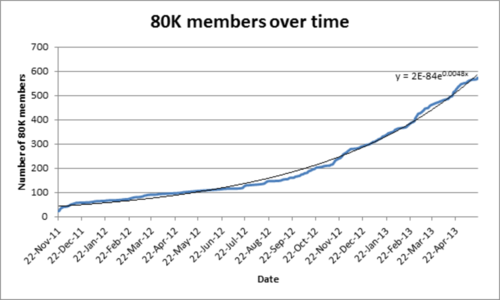
Membership Data
At the close of this period, 80,000 Hours had 813 members. The table below reports data on our membership from the last 6 months and the previous 6 months, as well as the differences between these periods.
| Dec 2012 – May 2013 | Jun 2012 – Nov 2012 | Difference | % Increase | |
|---|---|---|---|---|
| New Members | 395 (15/week) | 180 (7/week) | 215 | 120% |
| Reports of Significant Change in Career Direction | 53 (13%) | 8 (4.0%) | 45 | 560% |
| Completed Survey | 133 (34%) | 29 (16%) | 104 | 360% |
Composition of Membership
- The average age of our new members is 26.9 years. This has risen significantly from 23, since the press coverage and online outreach brought in new members from outside the effective altruist or university communities.
- 35% of our total members are women, and 65% are men. In the last 6 months, 38% of new members were women, and 62% of new members were men. In the previous 6 months, 38% of new members were women, and 62% of new members were men.
11% of members are from Oxford. This has substantially decreased from about 25%, since the press coverage and online outreach mainly brought in members from outside of Oxford.
Causes and Declarations of Intent
The table below reports data on the declarations of intent to donate by the overall 80,000 Hours membership, as well as the members who joined in the last 6 months and the previous 6 months.
| Dec 2012 – May 2013 | Jun 2012 – Nov 2012 | Overall | |
|---|---|---|---|
| Percentage who Declared intent to Donate | 20% | 28% | 20% |
| Average Amount Intended By Those who Declared Intent to Donate | 25% | 25% | 26% |
| Average Amount Intended to be Donated in Sample | 4.1% | 6.7% | 4.5% |
At this point, 19% of members report interest in improving health to address global poverty, 13% in ending factory farming, and 9% in reducing the risk of human extinction.
Careers Advising
We gave over 44 one-on-one advice sessions, compared to 43 in the previous period. In the previous period, we spoke to the majority of people who requested coaching. In this period, however, we received about 150 requests, so only talked to about 1 in 3 of the people who made requests. In addition, we interviewed 15 people one-on-one about their career planning problems.
Feedback on our coaching has been generally strong over the last year, especially in more recent times as we have been more selective with requests. In our follow up survey to coachees (completed by 56 of 95), coachees gave the following ratings:
How useful was the coaching session?
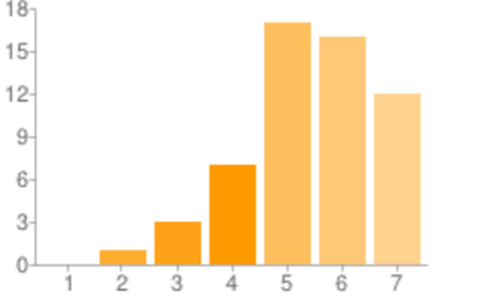
1 = waste of time
7 = extremely useful
y-axis = number of coachees
How likely are you to recommend our one-on-one careers advice to a friend?
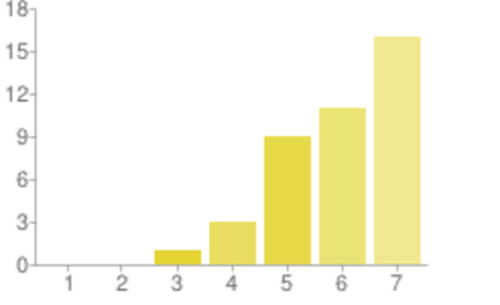
1= I definitely won’t
7 = I definitely will
y-axis = number of coachees