

End of year update on plan changes
NOTE: This piece is now out of date. More current information on our plans and impact can be found on our Evaluations page.
This is an update on the number of significant plan changes we’ve caused as of the end of Nov 2016.
We define a significant plan change as:
Someone tells us that 80,000 Hours caused them to change the career path they intend to pursue, in a way that they think increases their lifetime impact.
More on what counts as a significant plan change here.
Our total number of plan changes as of the end of Nov 2016 is 1,854, and after impact-adjusting these it’s 1,504.8.
Here’s a summary of our key figures:1
| Year | 2011 | 2012 | 2013 | 2014 | 2015 | 2016 (Jan-Nov) | All-time total |
|---|---|---|---|---|---|---|---|
| Reach: unique visitors to site | 4,266 | 46,924 | 91,999 | 149,164 | 513,697 | 834,310 | 1,640,360 |
| Year on year growth rate | NA | 1000% | 96% | 62% | 244% | 62% | NA |
| New newsletter subscribers added | 706 | 1,619 | 1,943 | 2,283 | 23,271 | 56,173 | 85,995 |
| Year on year growth rate | NA | 129% | 20% | 17% | 919% | 141% | NA |
| New impact-adjusted significant plan changes recorded (at end of year) | NA | NA | 125.0 | 148.7 | 320.2 | 910.9 | 1,504.8 |
| Year on year growth rate | NA | NA | NA | 19% | 115% | 184% | NA |
| Financial costs | 0 | £23,100 | £116,019 | £121,003 | £221,380 | £228,080 | £709,582 |
| Labour costs (in person-years, inc. volunteers and freelancers) | 1.7 | 3.4 | 7.5 | 4.9 | 4.8 | 5.0 | 27.2 |
| Financial costs per impact-adjusted plan change | NA | NA | £928 | £814 | £691 | £250 | £472 |
Table of Contents
Impact-adjustment of plan changes
In October 2015, we started rating plan changes with a value of 0.1, 1 or 10 based on our estimate of their counterfactual impact, in order to track the quality of plan changes over time. Read more.
Number of plan changes
Here’s the breakdown by year:
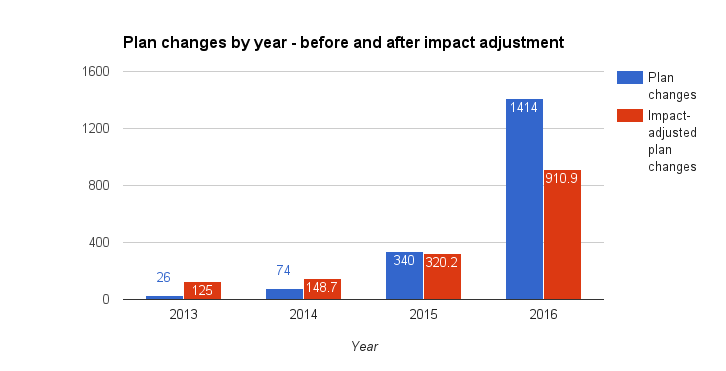
Note that we only started collecting plan changes in 2013, but started outreach in 2011. This means the 2013 figures reflect three years of work rather than one, so our growth from 2013 to 2014 was better than it looks from these charts. Also, the figures for 2016 don’t include December, so our year-on-year growth rates will be somewhat higher once all of 2016 is included.
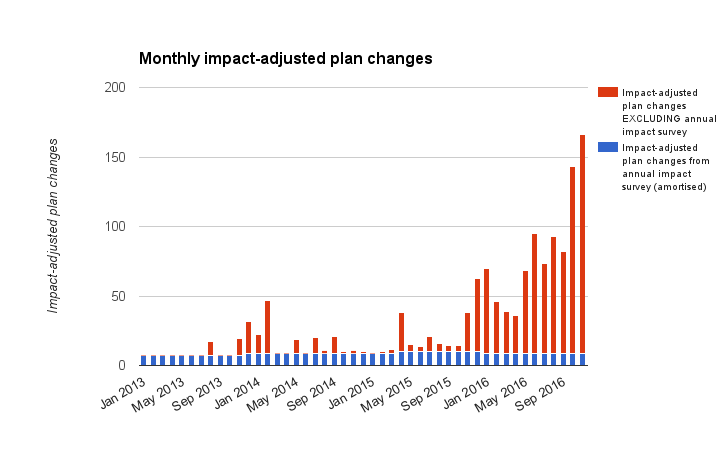
Our month-on-month growth rates over 3 years are faster than our year-on-year growth rates, because we grew quickly during 2016. Here are our monthly impact-adjusted plan changes, with plan changes we learned about from our annual impact surveys amortised:
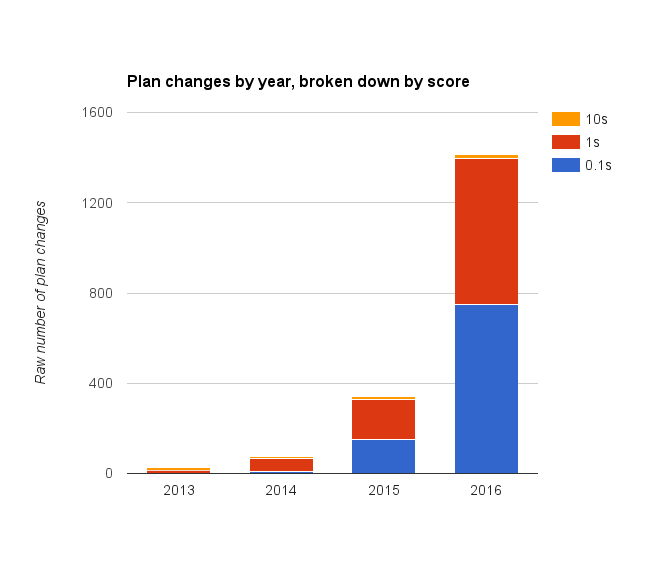
Here are the proportions of plan changes that we scored with the values 0.1, 1 and 10 each year. As you can see, most plan changes are scored as 0.1 or 1, and there are only a few 10s:
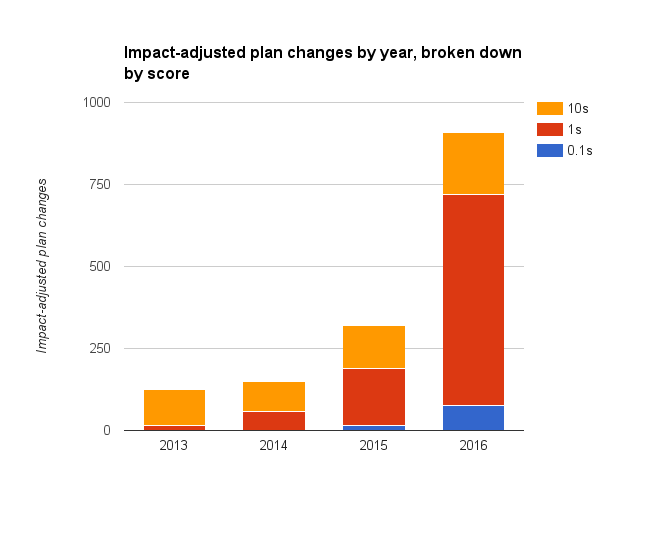
Here are our impact-adjusted plan changes per year, again broken down by their scores:
Finally, here our monthly impact-adjusted plan changes broken down by their scores (excluding those we learned about in our annual impact surveys):
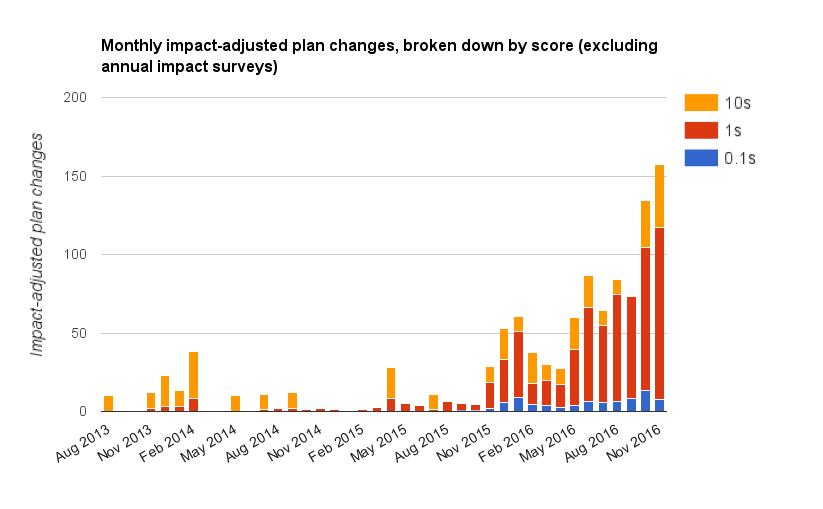
Most of our growth has been driven by the 1s. This is because (as is shown below) growth has largely been driven by (i) workshops (ii) our online tools and the on-going impact survey (benefiting from higher web traffic) and (iii) more people taking the Giving What We Can pledge.
These sources tend to produce 1s rather than 10s, especially in the short-term. However, we think about 10% of these 1s will become 10s over the coming years. It’s hard to become a 10 right away because it requires a big shift.
How did we find out about the plan changes?
We learn about significant plan changes when our users fill out our online surveys, feedback forms, or through emailing users directly. The main sources are:
- Impact survey – we have a survey on our website which about 5-10 people fill out per week. Once a year we also send the survey out to everyone on our newsletter — we call this our ‘annual impact survey’.
- Online tools – our tools survey users on whether 80,000 Hours caused them to change their career plans.
- Workshops and coaching – all workshop attendees and people we coach are asked to fill out a feedback form which asks them if they changed their plans.
- Manual correspondence – we email a small fraction of our users to ask if they changed their careers plans due to us.
- From Giving What We Can – we email Giving What We Can members who say they heard of GWWC through 80,000 Hours to ask whether they took the pledge due to us.
How we learned about impact-adjusted significant plan changes in 2016:
| Source | Percentage |
|---|---|
| Tools | 30% |
| Workshops/coaching | 29% |
| Manual correspondence | 13% |
| Annual impact survey | 10% |
| From GWWC | 10% |
| Ongoing impact survey | 7% |
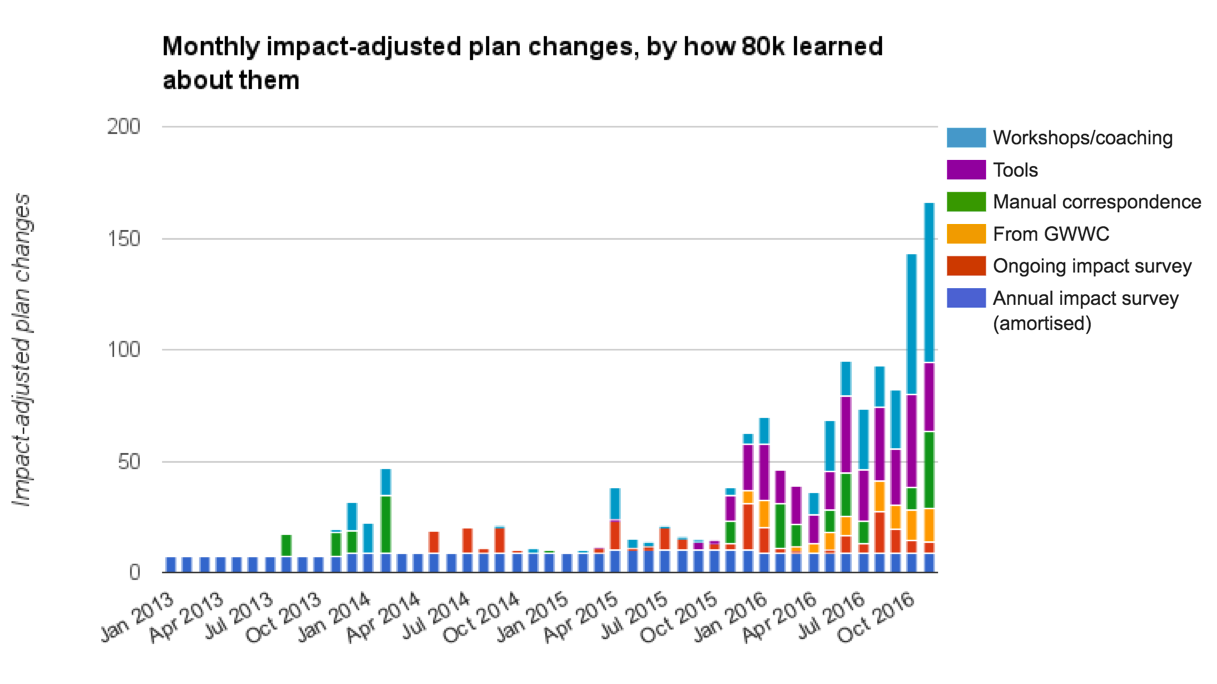
Here are our monthly impact-adjusted plan changes broken down by how we learned about them:
Plan change statistics
What did the changes consist of?
You can see some examples of plan changes in our annual review (forthcoming). There are summary statistics below.
In October 2016 we added new questions to our plan change surveys, asking users for more information. One new multiple choice question we now ask is What did the change consist of?
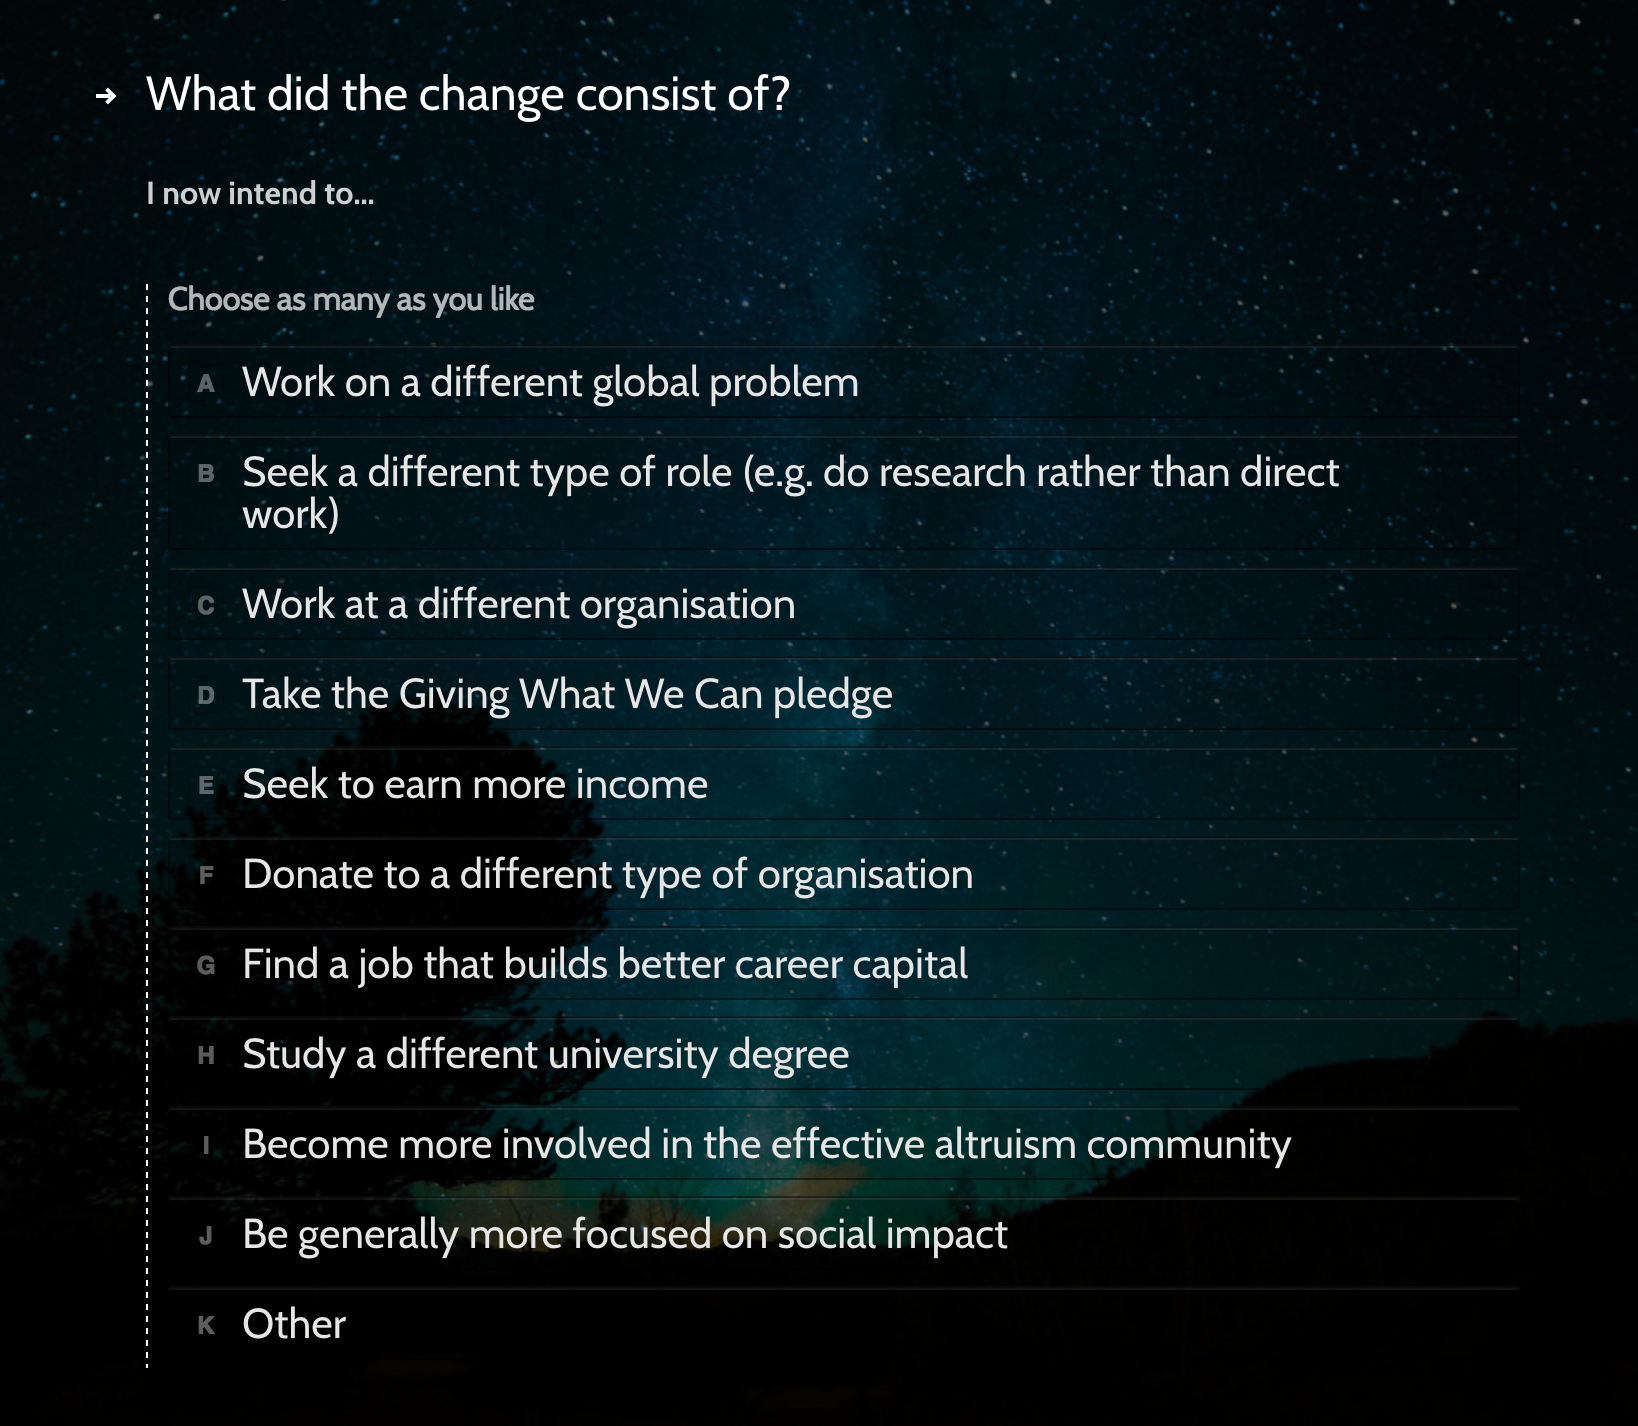
446 people who made significant plan changes have answered this question so far (out of a total 1,414 people who made a plan change in 2016).
Here are the proportions of impact-adjusted plan changes which included the different options (note that people could select multiple options):
| Answer includes | Percentage |
|---|---|
| Find a job that builds better career capital | 55% |
| Seek a different type of role (e.g. do research rather than direct work) | 52% |
| Be generally more focused on social impact | 47% |
| Become more involved in EA community | 41% |
| Seek to earn more income | 33% |
| Work on a different global problem | 28% |
| Donate to a different type of organisation | 26% |
| Take GWWC pledge | 24% |
| Work at a different organisation | 24% |
| Study a different university degree | 17% |
| Other | 0.4% |
What did plan changes scored “10” switch into?
We categorised the plan changes which we scored as 10s in 2015 and 2016 by the paths they switched into:
| Category | Number | Percentage |
|---|---|---|
| EA org | 16 | 50% |
| Earning to Give (expected donations above $100k/year) | 5 | 16% |
| High-net-worth donor to top causes | 3 | 9% |
| Running EA student group | 3 | 9% |
| AI safety research | 2 | 6% |
| AI safety capacity building | 1 | 3% |
| Machine learning grad study | 1 | 3% |
| For-profit start-up for global poor | 1 | 3% |
| Total | 32 | 100% |
What did plan changes scored “1” switch into?
We selected a random sample of 30 plan changes scored as 1s in 2016, and categorised them by what they now intend to do.
| Category | Number | Percentage |
|---|---|---|
| Took GWWC pledge | 7 | 23% |
| Policy (focused on top problem areas) | 5 | 17% |
| Corporate sector for skills (planning to work on top problem areas) | 3 | 10% |
| EA org | 2 | 7% |
| Learn programming (actively involved in EA community) | 2 | 7% |
| Startup | 2 | 7% |
| Data science (and planning to donate over 10%) | 2 | 7% |
| Econ/Machine learning PhD | 2 | 7% |
| Change to quantitative major (planning to work on top problem areas) | 2 | 7% |
| Donate 20% of income | 1 | 3% |
| Earning to Give (expected donations above $10k/year) | 1 | 3% |
| Non-profit (impact evaluation) | 1 | 3% |
What did plan changes scored “0.1” switch into?
We did the same for a random sample of 30 plan changes scored as 0.1 in 2016:
| Category | Number | Percentage |
|---|---|---|
| Corporate sector for skills (less evidence planning to work on top problem areas) | 10 | 33% |
| Earning to Give (expected donations less than $10k/year) | 5 | 17% |
| Policy (less evidence planning to work on top problem areas) | 3 | 10% |
| Biomedical research (smaller shift from previous intentions) | 3 | 10% |
| Software engineering (less evidence planning to work on top problem areas) | 2 | 7% |
| Change to quantitative major (less evidence planning to work on top problem areas) | 2 | 7% |
| Applied Maths PhD (less evidence planning to work on top problem areas) | 1 | 3% |
| Promote EA as teacher | 1 | 3% |
| Switch donations to effective charities | 1 | 3% |
| Data science (less evidence planning to work on top problem areas) | 1 | 3% |
| Non-profit (less evidence of focus on top problem areas) | 1 | 3% |
How many people took the Giving What We Can pledge due to 80,000 Hours?
In 2016 we tracked 115 people who took the Giving What We Can pledge due to 80,000 Hours. This is 8% of our plan changes for the year, and 13% of our impact-adjusted plan changes.
We track this figure by emailing people who take the pledge and say that they first heard about Giving What We Can through 80,000 Hours, and ask them how likely it is that they would have taken the pledge if 80,000 Hours didn’t exist. We also track people who say in our impact surveys that they now intend to take the pledge due to 80,000 Hours, and who then become members.
Which causes are people planning to work on?
Another new question we added in October 2016 is: Which global problem or cause are you planning to work on with your career?
415 people who made significant plan changes have answered this question so far, with the following results (again, note that people could select multiple options):
| Answer includes | Percentage |
|---|---|
| Economic empowerment in poor countries | 37% |
| Health in poor countries | 36% |
| Promoting EA | 33% |
| Global priorities research | 32% |
| Climate change | 32% |
| Risks posed by artificial intelligence | 26% |
| Undecided | 21% |
| Factory farming | 19% |
| Biosecurity | 9% |
| Nuclear weapons | 5% |
| Other | 3% |
15% of people who said that they now intend to work on a different global problem, chose at least one of the following, and didn’t choose any of the other causes:
- Promoting effective altruism
- Global priorities research
- Risks from artificial intelligence
- Biosecurity
So roughly 15% of the plan changes (based on the sample) are switching into our top priority areas.
How involved in the effective altruism community are people who make plan changes?
We also ask people who made a plan change: Do you consider yourself an active supporter of “effective altruism”? 466 people who made a significant plan change have answered this question so far, with the following responses:
| Answer | Percentage |
|---|---|
| I like the ideas but I'm not yet actively involved | 68% |
| I'm actively involved in the community | 17% |
| I'm heavily involved in the community and promoting the ideas | 9% |
| I'm not sure what this is | 6% |
| No - I have reservations about it | 1% |
How did they first hear about 80,000 Hours?
130 people who made plan changes answered the question How did you first find out about 80,000 Hours?, with the following results:
| Answer | Percentage (not impact-adjusted) | Percentage (impact-adjusted) |
|---|---|---|
| Recommendation from a friend | 18% | 30% |
| Through another effective altruist organisation | 22% | 21% |
| I don't remember | 13% | 14% |
| Search engine | 9% | 6% |
| Link on social media | 8% | 6% |
| Link on other website | 6% | 5% |
| Peter Singer | 5% | 5% |
| Through effectivealtruism.org / EA newsletter | 5% | 3% |
| Tim Ferriss podcast | 3% | 2% |
| Media coverage | 2% | 2% |
| Doing Good Better | 2% | 2% |
| Other | 5% | 2% |
To sum up the main sources for the impact-adjusted plan changes: 30% came from word-of-mouth, 31% from the effective altruism community, and 21% from online outreach.
What caused the plan changes?
We ask each person who reports a plan change What was most significant in triggering these plan changes? Here are the breakdowns of what caused plan changes by year:
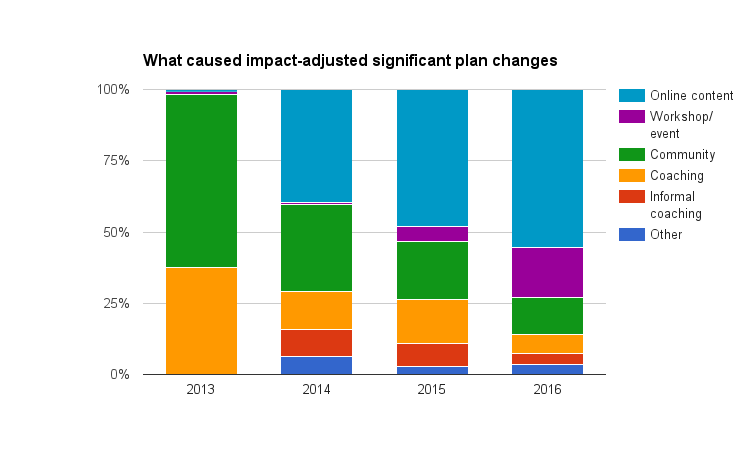
Compared with previous years, plan changes caused by online content and workshops have gone up, and the percentage of plan changes caused by our community and coaching have gone down. This is in line with our expectations because we spent 2016 focused on improving our online content and delivering workshops, and didn’t do much coaching.
Here is the same chart but with the absolute numbers of impact-adjusted plan changes each year:
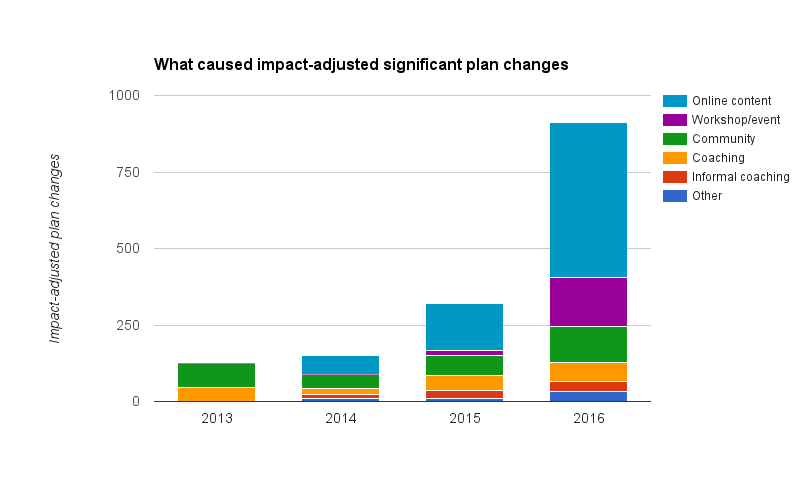
As can be seen, most of our growth in 2016 was driven by plan changes caused by online content and by workshops.
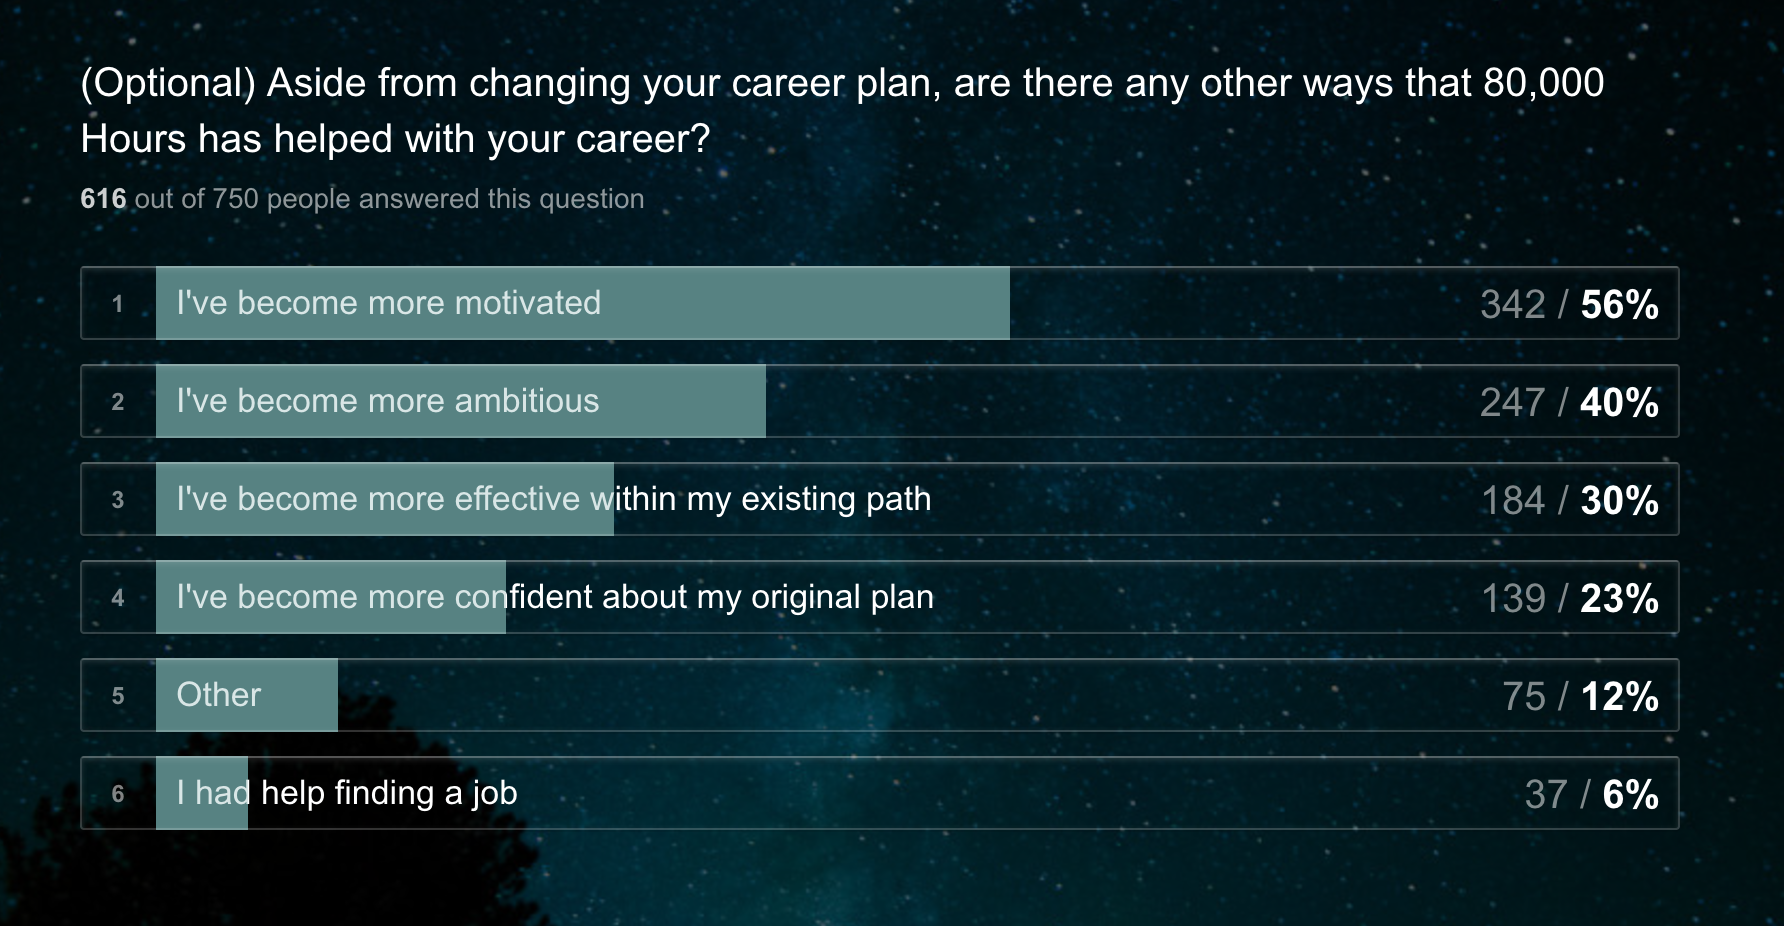
Other ways we helped our users
We also asked our users if there are ways we’ve helped them with their careers besides changing their career plans. Here are the results:
Notes and references
- In our previous report the number of plan changes for 2015 are reported as slightly higher (326.9 vs 320). This difference is due to people who made plan changes in 2015 making subsequent plan changes in 2016 with a higher impact adjusted value, meaning they are recorded in 2016 instead, and due to disconfirming 2015 plan changes in light of new information.
Also note that our cost figures are preliminary estimates. Our UK accounts with CEA UK have been audited through the end of June 2015 and the US accounts with CEA USA through the end of Dec 2015. But costs after that time will be subject to revisions.
We measure unique visitors to our website using the Google Analytics client side tracking library. We believe that a significant fraction (~20-50%) of our website visitors use browser extensions that block this tracking method, so our true visitor numbers are higher.↩