

Which industry has the highest-paying jobs?
Which industry has the highest paying jobs?
Simple question. Hard to answer.
Until recently, good data wasn’t available: tax returns weren’t consistently categorised by job type until 2005.
Many rankings of the highest-paying jobs are based on job seeker surveys from GlassDoor, and this almost entirely misses the highest-earning people.
Other rankings, such as this one by US News, use median earnings rather than the mean, making them uninformative for industries with a wide spread of earnings.
The government’s Bureau of Labor Statistics (BLS) is much better, but it still doesn’t properly sample the highest-earning people.
But we’ve got hold of a forthcoming paper by three economists, Benjamin Lockwood (UPenn), Charles Nathanson (Northwestern University) and Glen Weyl (Yale) that combines the BLS figures with new tax data to accurately estimate the whole income distribution of the 11 highest-earning professions.1 This is the best ranking we’re currently aware of.
In this article, we explore this data, and how it could be used to estimate the expected lifetime income of different professions.
At 80,000 Hours, we help people we find fulfilling careers with positive impact. Earning more money only makes you a little happier, but it can be used to have a big positive impact. If you’re reading this, while you might not be in the top 1% of income in the US, you’re very likely to be in the top 1% by income globally. This means you have enormous power to have a positive impact in the world by donating 10% of your income to highly effective charities.
By seeking a higher-earning job, you might be able to have even more impact, a path we call ‘earning to give’. If you’re interested in other ways to have a big positive impact, such as research, government or non-profits, see our key ideas page.
List of the highest paying jobs
| Profession | Mean income in 2005 (estimated) | Median Income | 99th Percentile Income | Population Share |
|---|---|---|---|---|
| Medicine | $288,000 | $203,000 | $1,348,000 | 0.5% |
| Law | $264,000 | $113,000 | $1,627,000 | 0.4% |
| Finance | $245,333 | $92,000 | $2,075,000 | 0.9% |
| Real Estate | $176,000 | $50,000 | $1,393,000 | 0.3% |
| Management | $164,923 | $78,000 | $1,273,000 | 3.9% |
| Engineering & programming | $98,400 | $73,000 | $452,000 | 2.0% |
| Research | $82,909 | $59,000 | $399,000 | 1.1% |
| Operations & consulting | $74,000 | $51,000 | $368,000 | 2.4% |
| Sales | $73,043 | $48,000 | $414,000 | 2.3% |
| Art, sport & entertainment | $72,000 | $40,000 | $497,000 | 1.0% |
| Teaching | $51,000 | $43,000 | $126,000 | 3.2% |
| All other jobs | $33,717 | $26,000 | $111,000 | 82.0% |
Note that all income is pre-tax in 2005. Average wages have risen about 30% since then in nominal terms.2
Medicine comes out top. Half of doctors in the US earn over $200,000 per year, and the mean is actually higher than finance and law.
That said, the very highest-earning people are in finance and law. The top 1% in finance earn over $2m per year. Since finance makes up 0.9% of the workforce of 160 million, that’s well over 10,000 people.
And, because there are 8-times as many managers as doctors, the majority of the highest-earning people are managers.
Earnings are most unequally distributed in finance and real estate. The top 1% in real estate earn 27 times as much as the median.
People in art, sport and entertainment have the lowest median, lower than teachers, but the most successful earn over $500,000.
It’s also possible to get rich as an engineer or salesperson, and as we’ll show later, a pilot or blue collar worker.
Below we cover some details of the analysis, and how to predict lifetime income in different jobs.
Table of Contents
- 1 Get our guide in your inbox.
- 2 List of the highest paying jobs
- 3 Which jobs are included in the table?
- 4 How do the highest-earning people make their money?
- 5 Which high-paying jobs are missing? How to make it into the top 1% as a blue collar worker.
- 6 What about narrower categories of job?
- 7 What about other countries?
- 8 What about capital gains?
- 9 What about lifetime income?
- 10 In which job should you earn to give?
- 11 You might also be interested in
Which jobs are included in the table?
Collectively, the 11 professions in the table above (excluding “Other”) account for 18% of jobs and 42% of income. They cover about 60% of people earning over $100,000 and over 90% of those earning above $300,000.3
Here’s how the professions were defined (the links go to our most relevant profiles where you can get more information):
- Art (artists, entertainers, writers, and athletes)
- Engineering (computer programmers and engineers)
- Finance (financial managers, financial analysts, financial advisers, and securities traders),
- Law (lawyers and judges)
- Management (executives and managers) (unfortunately this includes managers across many sectors)
- Medicine (doctors and dentists)
- Operations (consultants and IT professionals)
- Real Estate (brokers, property managers and appraisers)
- Research (professors and scientists)
- Sales (sales representatives and advertising and insurance agents)
- Teaching (primary and secondary school teachers)
One problem is that the categories combine some pretty different roles. For instance, one reason why there’s so much skew in real estate is probably just because it includes appraisers, who earn about $50,000, as well as wealthy people who own hundreds of properties.
Unfortunately, there’s also no category that clearly captures technology entrepreneurship, even though this seems to have been the biggest driver of new wealth in the last decade. We’d guess they mainly fall in the ‘management’ category.
How do the highest-earning people make their money?
Here’s the fraction of each profession at each income level.
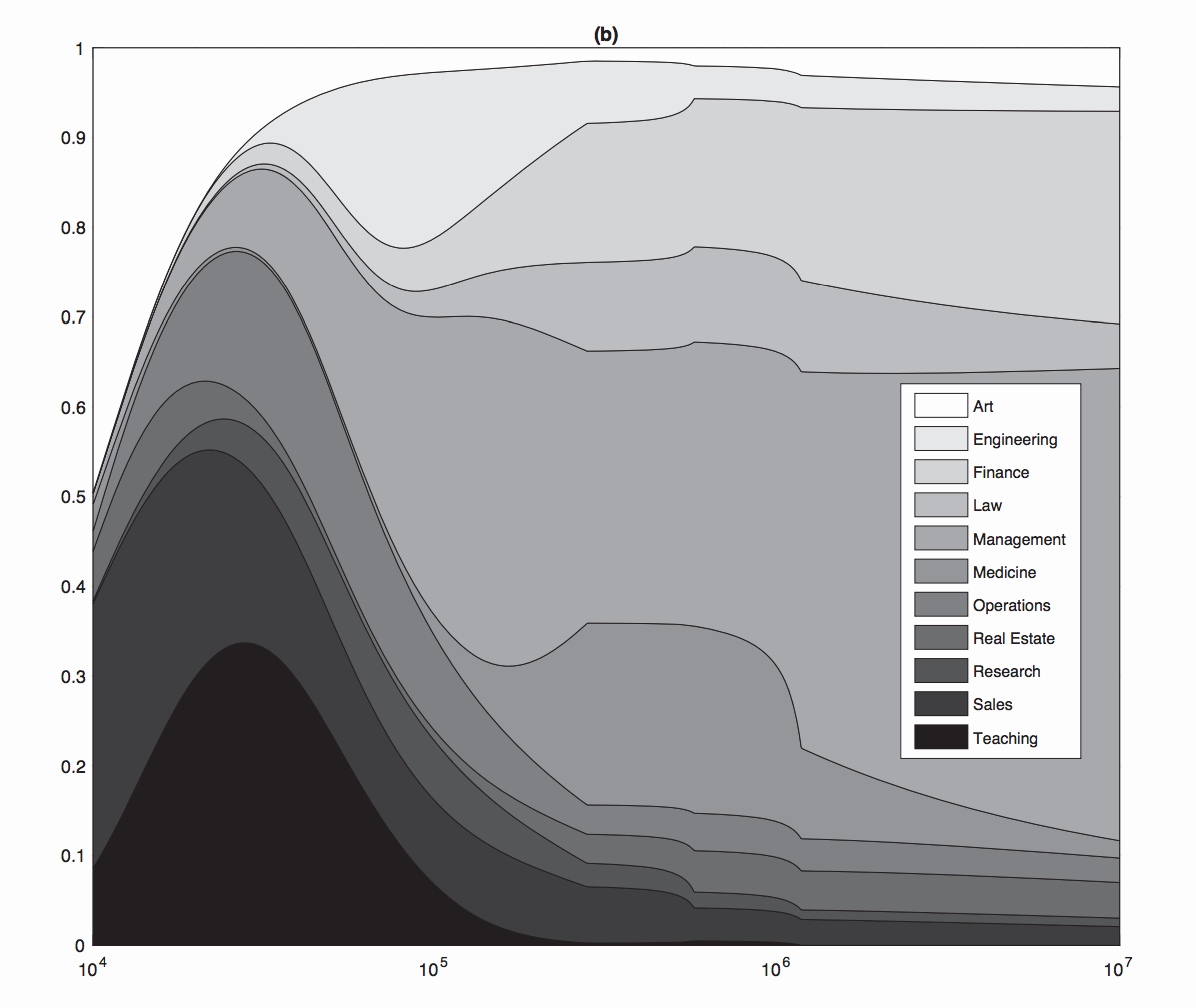
This means that of those earning about $10,000 per year in the professions listed above, 50% work in art (the “starving artists”), and most of the rest work in sales and teaching.
Those earning $300,000 per year mostly work in management, law, finance, and medicine.
Those earning over $10m per year mostly work in management and finance, though there are significant numbers in sales, real estate, operations, medicine, law, engineering and art at this level.
In fact, art has a bulge both at the bottom and at the very highest level of earnings – the celebrities.
You can see the odd kinks in the chart indicate some gaps and inconsistencies in the data, and it should be stressed that this is still a rough analysis.
Which high-paying jobs are missing? How to make it into the top 1% as a blue collar worker.
The professions listed above account for about 90% of the earnings of the highest-earning people.3 Who earns the other 10%?
The main paper used data from Bajika et al to estimate the incomes of the top 1%, who earned over $280,000 in 2005.4 The rest of the top 1% by income in the US, if they were working at all, had the following jobs (from most to least common):
- Blue collar.
- Entrepreneur (not elsewhere defined).
- Government and social services.
- Farmers and ranchers.
- Pilots.
It’s interesting you can make it into the top 1% as a pilot, farmer or blue collar worker. In fact, the average pilot makes about $150,000 per year. The top 10% of police supervisors earn over $130,000, the top 10% of construction supervisors earn over $100,000, and there are other blue collar jobs many earn over $100,000. The farmers who make it into the top 1% will be farm-owners rather than farm-workers.
Entrepreneurs might be the most interesting category for our audience, though most of them will already be included in the other categories. In Bakija at al’s data, they make up 2.95% of the top 1%, similar to the proportion of lawyers.4 However, they receive 40% of the income share of lawyers, suggesting their average earnings are 40% those of law. Since so many different roles can be counted as “entrepreneurship” – from small business owners to VC-funded tech founders – this doesn’t tell us much. It could also be that the highest-earning entrepreneurs are counted as managers or something else. Read more about entrepreneur earnings.
What about narrower categories of job?
If we picked narrower categories, medicine would be knocked off the top.
Goldman Sachs has over 33,000 employees who earn on average over $300,000 per year,5 and it’s similar at other investment banks. But this includes secretaries. If we only looked at the true “front office” staff, then the average would be significantly higher. The average front office banker in the UK who stays in the job past 35 likely earns over $500,000.6
We’ve also roughly estimated that hedge fund traders might earn a mean of $400-$900k. This would make “hedge fund trader” and “investment banking” the top of the table.
This, however, is an unfair comparison. While few people leave medicine, it’s very common to leave investment banking and trading due to the “up or out” promotion system. People can usually exit into other finance jobs if they like, so the expected earnings of someone entering this path are probably somewhere in between the mean for investment banking and the mean for finance as a whole. This would likely leave “investment banking” and “trading” at the top of the table, but the difference would be smaller.
Similarly, the average venture capital-backed startup founder earns over $1m per year, so this would put this category even higher than investment banking. But this path is really hard to enter, and few people pursue it for more than 10 years.
The earnings of “managers” would also vary hugely depending on which sector you work in, and many categories could easily beat medicine.
We’d like to do a more in-depth analysis, in which we split these professions into narrower categories, and try to estimate the expected earnings of someone who enters the path, taking into account the chance of dropping out. We’ve started doing this in our career reviews. Until then, the BLS data and also salary.com are probably the best resources for narrower categories (though bear in mind the weaknesses we’ve flagged).
What about other countries?
Wages elsewhere are generally lower. For instance, average wages in the US are about 30% higher than in the UK. Income in the US is also more unequal than the UK, further increasing the top salaries.7
However, it varies by profession. Healthcare jobs seem especially well-paid in the US compared to other countries. Computing jobs are also better paid in the US. However, some bankers and lawyers have internationally set salaries.
What about capital gains?
The figures above only include income, and not capital gains.8 This is a problem because many of the very highest-earning people are primarily compensated through capital gains. Indeed, because capital gains tax rates are lower than income tax rates, there’s an incentive to reclassify income as capital gains as much as possible.
In finance, for instance, the immense incomes of hedge fund and private equity managers have primarily taken the form of carried interest, treated as return on investment in their funds rather than as a wage. In many industries, stock options also play a major role in executive compensation.
What effect will adding capital gains have on the ranking?
First, it will increase everyone’s income. Most people with middle-class incomes save and invest some of their money, especially in housing, and this gives them the potential to earn capital gains.9
Second, it will disproportionately increase the income of the highest-earning people – especially executives, finance professionals and entrepreneurs – because they’re the most likely to be compensated through capital gains rather than wages. The income of the top 1% including capital gains is about 83% higher than their income excluding capital gains.4
(Note that the salary ranking we gave at the start covers people in 18% of jobs, not only the top 1% by income. This means it’s unclear what the effect of capital gains on these figures will be, although we can guess that the earnings of the 99th percentile should be roughly doubled to account for them.)
Third, it could change the relative ranking of the professions, because some will earn more through capital gains than others. In particular, it seems likely to favour finance, entrepreneurship and technology, which are the biggest sources of (non-inherited) wealth among the ultra-rich, and are areas where people often earn more through owning an asset than through their salary.
To make a rough comparison, we took the estimates from the paper by Bajika et al that was used in the main analysis:4
| Profession | Fraction of income of the top 1% earned by people in this profession, excluding capital gains (2005) | Including capital gains | Ratio of the two |
|---|---|---|---|
| Art | 2.5% | 2.2% | 91% |
| Engineering and computing | 3.5% | 3.5% | 100% |
| Finance | 16.3% | 16.4% | 101% |
| Law | 7.2% | 5.9% | 82% |
| Management | 37.4% | 37.5% | 100% |
| Medicine | 10.9% | 8.5% | 78% |
| Operations and consulting | 2.8% | 2.5% | 88% |
| Real Estate | 3.4% | 4.5% | 134% |
| Research | 1.4% | 1.4% | 102% |
| Sales | 3.1% | 2.6% | 83% |
| Government, teaching, social services | 0.5% | 0.7% | 126% |
| Entrepreneur, not elsewhere | 2.8% | 3.5% | 128% |
This shows that the income of those working in real estate, entrepreneurship and government is about 30% higher relative to the others when we include capital gains; while the income of those in law, medicine, operations, art, and sales is 10-20% lower.
So, if you consider capital gains, then the earnings of those working in real estate and entrepreneurship are higher than they look in the earlier table. This is what you’d expect, because these people primarily earn money by growing the value of their investments, rather than earning wages.
However, I was surprised to find that government income is higher. I don’t understand why this is and it could indicate a mistake in my analysis.
Finally, note that all these figures are still based on IRS tax returns. This means they don’t include all forms of compensation, such as expenses, which can easily amount to tens of thousands per year. Moreover, if these high-earners are hiding income from the IRS, then the figures will be understated.
What about lifetime income?
You can make a rough estimate of expected lifetime income by multiplying expected career length by the mean annual earnings.10 For the top 5 professions, this gives about $9m. Note that most people earn less than this, because the median is lower than the mean.
Some of these careers have different lengths. For instance, careers in sports or modelling sometimes only last a few years. Management can be hard to enter early, so you might have to spend years working in a lower-earning profession first. In finance, it’s common to leave early due to their “up or out” pattern of promotion.
You also need to account for the time spent and cost of training. Doctors in the US have to spend an extra four years in medical school, while management consultants start getting paid straight out of university. This reduces the relative lifetime earnings of medicine by about 10%.
Looking forward, your income will be earned over a 40 year period, so income growth matters. Real growth of 2% projected forward 20 years will make incomes about 50% higher.
Some professions will grow more quickly than others. For instance, since 1970, the financial industry has greatly increased its share of the US and UK economies, so finance, real estate and management have had the highest income growth (though this could easily reverse).
Investment banking compensation also fluctuates wildly with the movement of the economy and the stock market: some studies have claimed that boom or bust on Wall Street affects the expected earnings of elite business school graduates by millions of dollars.
In the last decade or so, the technology sector has become the largest driver of wealth among the ultra-wealthy, and the majority of the world’s largest companies are tech companies. Our data is from 2005, but if the analysis were repeated for 2020, technology would likely be a significantly bigger driver of the income of the top 1%.
Future swings in income could be even more unpredictable due to automation. If you want to maximise your expected earnings taking account of uncertainty, then make sure to gain flexible career capital, focusing on skills that are unlikely to be automated, and can be used in lots of areas. Management skills, leadership, problem solving, creativity and social skills seem most attractive on these grounds (as we explain in an upcoming post).
In which job should you earn to give?
At 80,000 Hours, we help people find jobs that have a positive impact, and many readers are interested in taking high-earning jobs so they can donate more to effective charities. We call this path earning to give. As you can see above, many people in these professions can earn enough to pay the salaries of several charity workers, researchers or teachers, so this can be a high-impact option.
If you want to take this path, where can you earn the most to donate?
- The key factor is personal fit – your chances of excelling in the career. The 99th percentile of a profession earns 5-30 times as much as the median, larger than the differences between professions, and you’re not going to reach this level if the job does not suit your strengths. Moreover, if you’re a poor personal fit, you’ll be more likely to leave the industry all together, further reducing your expected earnings.
Another key factor is which sub-options to aim for. The categories above are very broad, and contain many roles with different skill-sets. For instance, jobs in the tech industry have been lumped in with engineering, although the tech jobs are probably more attractive. We’re putting together more fine-grained estimates in our career reviews.
Then you also need to consider everything in the section just before, to estimate lifetime income, rather than just annual income.
Finally, some jobs also cost more of your income than others, and what ultimately matters is how much spare income you have to donate. For instance, the top finance jobs in the US are in NY, whereas you could practice medicine in many cities. We’ve previously suggested that in the US income above $40,000 doesn’t have much effect on happiness (ignoring kids), but the equivalent figure in central NY or SF is more like $60,000. That difference would reduce lifetime disposable income by about $0.8m over 40 years. Working in finance might also require you to spend more on professional networking, business attire and so on.
Which job is best all considered for earning to give?
- Even if you want to make earning to give your main focus, don’t simply do whatever you expect to be highest-earning. First, we recommend you avoid earning to give in options that cause harm directly, even if you could earn a lot (which we will discuss in detail in an upcoming post).
Don’t forget career capital. You might want to change job in the future, and you should consider your ability to advocate for important causes as well as donate. How much career capital you gain will depend a lot on your personal fit, but some options also seem to offer more flexibility than others.
You might also be interested in
Why earn to give: how it can be higher-impact to become an accountant than work at a charity.
Everything you need to know about whether money makes you happier
Notes and references
- Source: Table 3, Lockwood, Benjamin B, Nathanson, Charles and Weyl, E. Glen, “Taxation and the Allocation of Talent” (April 25, 2016). Journal of Political Economy, Forthcoming. Available at SSRN: https://ssrn.com/abstract=1324424 or http://dx.doi.org/10.2139/ssrn.1324424.
Briefly, they used estimates of the income of the top 0.1% and top 1% from Bakija 2012 (which uses IRS tax returns), associated them with occupations, then fit them to an appropriate distribution. See the paper for the full details.
The paper only provides the median and 99th percentile. To estimate the mean, we divided the income share of the profession by the share of people in the job, then multiplied by the mean income in their data set of $48,000. This figure was given to us in personal correspondence by the authors. Note that it’s higher than mean personal income in 2005 given by FRED, because FRED’s figures are for (i) people over age 15 and (ii) include both the employed and the unemployed.↩
- Using FRED data for Average Hourly Earnings of All Employees: Total Private (CES0500000003) Link, retrieved 28-April-2017. Wages were $20.04/hour 1-March-2006 (when the data series starts), and $26.14 1-March-2017, which is 30.4% higher.↩
- This is shown in panel A on the final page of Lockwood et al.↩
- Bakija, Jon, Cole, Adam and Heim, Bradley T. “Jobs and income growth of top earners and the causes of changing income inequality: Evidence from US tax return data.” Unpublished manuscript, Williams College (2012). Archived link, retrieved 18-April-2017.
The share of income of the top 1% going to other professions is shown in table 6 (excluding capital gains).
The fraction of the top 1% working as entrepreneurs is given by table A.3.
About 45% of the income of the top 1% comes from capital gains.
Total income including and excluding capital gains for the top 1% is given by table A.2.
To find the table of relative income from capital gains, the fraction of income including and excluding capital gains was taken from table 6 and table 6a. I divided by the total share of income going to the top 1%, to calculate the fraction for each profession.↩
- According to their annual report, Goldman paid about $11.65bn in compensation in 2016. Archived link, retrieved 20-April-2017. According to Statistia, they had 34,400 employees in 2016, so the mean is $339,000. The pay at top investment banks is generally thought to be similar, though Goldman might be at the higher end. Note that as we cover elsewhere, compensation dramatically fluctuates depending on the business cycle.↩
- This is how much you should earn as an investment banker in your 20s, 30s and 40s, Efinancialcareers, February 2016. Archived link, retrieved 20-April-2017. The mean for bankers aged 37-45 was £406,000, which is about $500,000. We didn’t look into how the data was gathered, so we’re not sure how accurate the figures are.↩
- According to the Office of National Statistics, average wages in the UK as of February 2017 were £509 per week link, retrieved 20-April-2017. At current exchange rates, this is US$650.
According to the OECD, the average person in the UK worked 1,674 hours per year in 2015, which is 32 hours per week, link, retrieved 20-April-2017. So, this is $20/hour. If average wages in the US are about $26 as of early 2017, then that’s 30% higher.
According to the World Bank, the UK has a GINI coefficient of 32.57 as of 2012. Link, retrieved 20-April-2017. In the US, however, it was 41.06, as of 2013. Link.↩
- Benjamin Lockwood confirmed to me in private correspondence that the figures in their paper did not include capital gains.↩
- Though note this isn’t relevant if your aim is to donate, because you can’t both invest and donate a dollar of income.↩
- Thank you to Carl Shulman for many of the points made in this post, in particular this article.↩